Unlocking the Power of Bollinger Bands for Smarter Trading Decisions
What Exactly Are Bollinger Bands and How Do They Function in Trading?
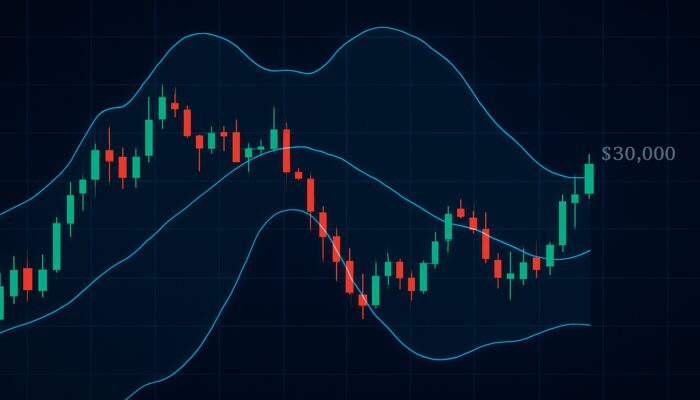

Bollinger Bands act as crucial volatility indicators within the sphere of crypto trading, enabling traders to identify significant price levels through the examination of simple moving averages (SMA) and standard deviations. The conventional approach involves computing the SMA over a 20-period timeframe, offering traders a clear view of price trends. For instance, when Bitcoin hovers around $30,000, the bands modify dynamically to indicate price shifts, assisting traders in determining whether the asset is overbought or oversold. This analytical method empowers traders to make educated, data-driven decisions, particularly in the inherently fluctuating crypto market.
Consider a situation where Ethereum experiences a rapid price increase, breaking through the upper Bollinger Band. This could signal overbought conditions, urging traders to proceed with caution. Conversely, if the price approaches the lower band, it may indicate an oversold state, prompting traders to evaluate potential buying opportunities. By skillfully employing Bollinger Bands, traders can navigate the unpredictable terrain of crypto assets, utilizing these indicators as indispensable tools in their trading toolkit.
Key Components That Define the Structure of Bollinger Bands
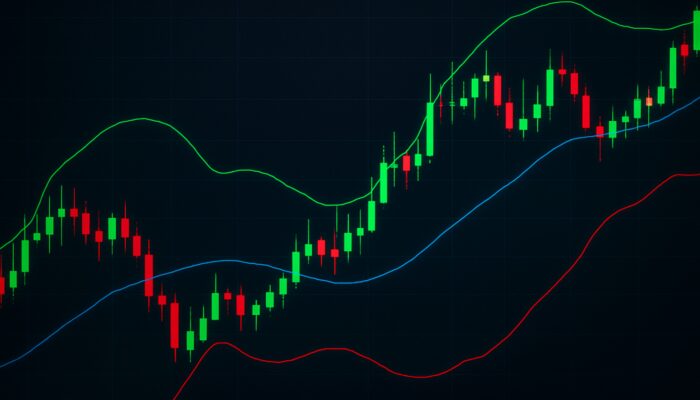
Bollinger Bands consist of three essential elements, each vital for evaluating market conditions. The central band represents the SMA, serving as a reference point for detecting price trends. The outer bands, located above and below the SMA, depict the standard deviations from this average. The distance between these bands varies according to market volatility; they expand during high volatility periods and contract during quieter market phases. Here are the critical components to recognize:
- Middle Band (SMA): Generally calculated over a 20-period timeframe.
- Upper Band: Determined as Middle Band + (Standard Deviation x Multiplier).
- Lower Band: Calculated as Middle Band – (Standard Deviation x Multiplier).
- Standard Deviation: Indicates the variability of prices around the SMA.
Understanding these components allows traders to effectively discern market trends and volatility. For example, if a trader notices the bands tightening, it may signal an upcoming price breakout, while expanding bands could suggest increased volatility, offering vital insights into market behavior.
What Strategies Can Traders Use to Seamlessly Integrate Bollinger Bands into Their Trading Plans?
Integrating Bollinger Bands into trading strategies significantly boosts a trader’s ability to identify optimal entry and exit points by scrutinizing price movements in relation to the bands. A structured methodology includes several actionable steps for effective implementation:
1. Spotting the Squeeze: Look for instances of band contraction, indicating low volatility and the potential for impending price movements.
2. Observing Breakouts: After a breakout above or below the bands, evaluate the direction of the movement—this may indicate a robust trend.
3. Utilizing Band Reversals: When the price touches or crosses the bands, this serves as a signal for potential reversal opportunities.
4. Combining with Additional Indicators: Enhance your analysis by pairing Bollinger Bands with other technical indicators such as the Relative Strength Index (RSI), providing a more comprehensive view of market conditions.
By adopting these strategies, traders can utilize Bollinger Bands as crucial indicators within their trading arsenal, enhancing decision-making capabilities and adapting to the constantly shifting dynamics of the crypto market.
How to Effectively Analyse Market Trends Utilizing Bollinger Bands?
Practical Steps to Effectively Apply Bollinger Bands in Cryptocurrency Trading
To effectively apply Bollinger Bands, traders need to develop a deep understanding of market behavior and price dynamics. Here’s a structured approach for leveraging Bollinger Bands to analyse cryptocurrency prices:
1. Configure the Bands: Start by setting up the Bollinger Bands on your trading platform, typically using default settings of a 20-period SMA with standard deviation multipliers set to 2.
2. Monitor Market Conditions: Be alert to instances of price compression, often referred to as squeezes, where the bands converge, indicating low volatility and the likelihood of a breakout.
3. Analyse Breakouts: Upon a breakout, assess the direction of the price movement—if it exceeds the upper band, consider potential long positions; if it falls below the lower band, this could signal short opportunities.
4. Identify Patterns: Recognize prevalent patterns such as “the squeeze” and “band riding,” where prices oscillate between the bands, indicating ongoing trends.
Traders should maintain a balanced perspective, steering clear of hasty conclusions based solely on breaches of the bands. Instead, integrating these visual observations with market sentiment and other technical indicators enhances predictive capabilities. For instance, if Bitcoin exhibits a band squeeze alongside an RSI divergence, traders may prepare for a significant price movement, whether upward or downward.
How to Recognize Common Trading Patterns with Bollinger Bands?
Bollinger Bands reveal several important patterns that traders can leverage within the cryptocurrency markets. One of the most significant is the band squeeze—a phase characterized by low volatility that frequently precedes a price breakout. When traders observe the bands contracting notably, it typically signals an impending substantial price movement. Key patterns to look for include:
1. Squeeze: A clear indicator that the crypto asset is experiencing low volatility, often leading to a price breakout.
2. Breakouts: When the price breaches the upper band, it may signify a bullish trend, while a breach below the lower band could indicate a bearish trend.
3. Riding the Bands: When prices trend along the upper or lower band, it suggests a strong trend, allowing traders to gauge the strength of market movement.
4. Double Bottom or Double Top Patterns: These occur when the price tests the bands multiple times, indicating potential reversals.
For example, if a trader observes Bitcoin trading near the lower band while identifying a double bottom pattern, this may signal a promising buying opportunity. By recognizing these patterns, traders can make informed decisions, capitalizing on potential price movements while effectively managing their risks.
What Factors Impact the Width of Bollinger Bands?
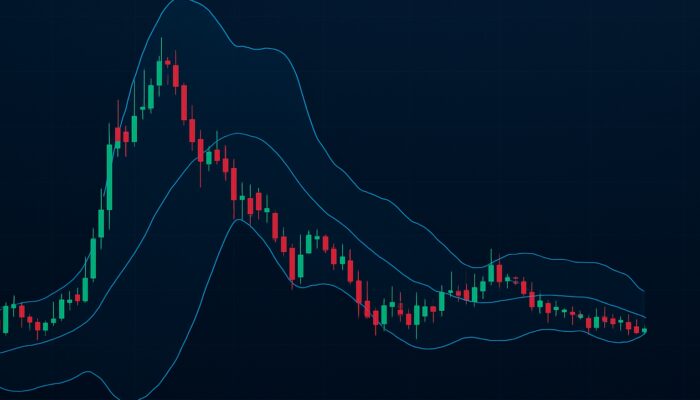
The width of Bollinger Bands is greatly influenced by a range of market factors, primarily the volatility of the cryptocurrency asset. When prices fluctuate dramatically, the bands widen, indicating heightened volatility, while tighter bands suggest market stability. Key elements affecting bandwidth include:
1. Price Movements: Rapid price changes result in a greater standard deviation, causing the bands to widen.
2. Market Sentiment: Increased trading activity can trigger volatility spikes, significantly influencing band width.
3. News and Events: Major announcements or macroeconomic factors can instigate sudden price shifts, affecting the bands’ formation.
4. Market Trends: Trending markets generally display wider bands due to sustained price movements, while sideways markets may yield narrower bands.
By understanding these factors, traders can better interpret signals from Bollinger Bands and apply this knowledge to their trading strategies. For example, if the bands widen considerably during a market event, traders might modify their strategies to prepare for increased price volatility, establishing suitable stop-loss orders to effectively manage risk.
How to Decode Signals from Bollinger Bands for Trading Success?
Deciphering signals from Bollinger Bands is essential in crypto trading, as it allows traders to assess potential market movements. Key signals derived from the bands include:
– Price Breaches: When prices approach or exceed the upper or lower bands, it suggests possible reversals or continuations. A price breach above the upper band might indicate an overbought state, while a breach below the lower band could imply an oversold market.
– Band Squeezes: A narrow band width warns of low market volatility and anticipates a potential price breakout. Traders should prepare for significant price movements, either upwards or downwards, following this signal.
– Band Riding: If the price consistently trends along the upper band, it signals strong bullish momentum. Conversely, if prices consistently follow the lower band, it indicates bearish sentiment.
To strategically enter and exit trades, traders should align these signals with other indicators. For example, if Bitcoin breaches the upper band while the RSI reads above 70, it reinforces the overbought condition and suggests a possible reversal. Conversely, if the price touches the lower band while the RSI is below 30, it may present a buying opportunity. Leveraging these interpretations can enhance decision-making processes and improve overall trading success.
Strategies for Integrating Bollinger Bands with Other Technical Indicators for Enhanced Insights
Combining Bollinger Bands with additional technical indicators can significantly elevate trading strategies. Merging Bollinger Bands with tools such as the Relative Strength Index (RSI) or Moving Average Convergence/Divergence (MACD) allows for a more detailed analysis of market conditions and trends. Here are effective strategies for integration:
1. RSI and Bollinger Bands: Employ RSI to confirm overbought or oversold conditions indicated by the bands. For instance, if the price breaches the upper band and the RSI crosses above 70, consider this a strong signal of a potential price reversal.
2. MACD Divergence: Identify divergences between MACD and price movements when prices approach the bands. A bullish divergence during a lower-band breach could signal a potential upward correction.
3. Volume Analysis: Pair Bollinger Bands with volume indicators to gauge the strength of price movements. An increase in volume accompanying a breakout reinforces the validity of the price signal.
4. Moving Averages: Integrate Bollinger Bands with shorter-term moving averages to identify crossovers, offering additional entry and exit signals based on market momentum.
By implementing these strategies, traders can refine their decision-making processes and achieve more precise predictions of market trends and volatility. Regularly evaluating and adapting these combined indicators ensures an agile approach to the ever-evolving crypto landscape.
Expert Insights on Maximizing the Efficiency of Bollinger Bands in Crypto Trading
Advanced Techniques for Enhancing the Application of Bollinger Bands
To master Bollinger Bands in crypto trading, traders should explore advanced techniques that amplify their application. These methods involve leveraging the bands alongside other indicators and customizing parameters based on specific market conditions. Here are actionable steps for optimizing strategies:
1. Modifying Periods and Deviations: Tailor the SMA period and standard deviation multipliers according to market volatility and trading strategies. During high volatility periods, consider increasing the SMA period to smooth price data and minimize false signals.
2. Combining with Fibonacci Retracement: Utilize Bollinger Bands alongside Fibonacci retracement levels to identify potential reversal zones. If the price nears a Fibonacci level as it approaches the lower band, it may indicate a strong buying opportunity.
3. Multi-Timeframe Analysis: Examine Bollinger Bands across various timeframes for a more comprehensive perspective. For instance, a squeeze on a daily chart might suggest an upcoming breakout, which can be refined by analysing hourly or 15-minute charts.
4. Backtesting Strategies: Regularly backtest trading strategies involving Bollinger Bands to identify optimal setups and refine entry and exit criteria. This practice enhances confidence in strategy execution.
By implementing these advanced techniques, traders can achieve greater precision in their trades, enabling them to navigate the complexities of the crypto market with improved confidence and effectiveness.
Benefits of Mastering Bollinger Bands for Cryptocurrency Traders
Mastering Bollinger Bands offers numerous advantages for cryptocurrency traders, particularly in identifying trends and managing risk effectively. Below are key benefits that significantly enhance trading performance:
- Spotting Trend Shifts: Bollinger Bands assist traders in recognizing potential trend reversals through band interactions, enabling timely entries and exits.
- Enhanced Risk Management: By delineating support and resistance levels, Bollinger Bands empower traders to establish informed stop-loss levels, minimizing potential losses.
- Improved Decision-Making: The visual representation of volatility aids traders in making more informed decisions based on prevailing market conditions.
- Strengthening Trading Discipline: By relying on data-driven strategies, traders can avoid emotional decision-making and consistently adhere to their trading plans.
These advantages affirm Bollinger Bands as a fundamental tool in every trader’s toolkit. Traders who master these indicators can adapt more effectively to fluctuating market conditions and make calculated decisions, ultimately enhancing their trading performance.
Understanding the Limitations of Bollinger Bands in Trading
While Bollinger Bands are highly effective, they come with limitations that traders must recognize to avoid potential pitfalls. Some common challenges include:
1. False Signals: In sideways or choppy markets, Bollinger Bands may produce misleading signals, leading traders to enter or exit trades prematurely.
2. Over-reliance on the Bands: Relying solely on Bollinger Bands without corroborating indicators can lead to misguided trades. Integrating them with other analytical tools is essential for enhanced accuracy.
3. Lagging Indicator: As a lagging indicator, Bollinger Bands may not respond quickly enough to sudden price fluctuations, potentially missing critical trading opportunities.
4. Parameter Adjustments: Traders may find themselves frequently adjusting parameters to align with market conditions, leading to inconsistent strategies.
By acknowledging these limitations, traders can mitigate risks and enhance their overall strategies. Combining Bollinger Bands with complementary indicators and maintaining a comprehensive approach ensures better engagement with the market and minimizes the risk of capital erosion from misinterpretation.
Highlighting Successful Use of Bollinger Bands in Crypto Trading Through Case Studies
Real-world case studies demonstrate the effectiveness of Bollinger Bands in crypto trading. Here are notable examples illustrating how traders have successfully applied these indicators:
1. Bitcoin Breakout in 2021: During the significant price surge of Bitcoin in early 2021, traders observed a consistent band squeeze followed by a breakout above the upper band. Many traders capitalized on this momentum, integrating the breakout signal with volume analysis for increased confidence in their trades.
2. Ethereum Reversal Strategy: When Ethereum approached its lower Bollinger Band amidst bearish sentiment, savvy traders noted the convergence of RSI, indicating oversold conditions. This led to a profitable long position as the price rallied back towards the SMA.
3. Litecoin Trend Following: A trader utilizing Bollinger Bands on Litecoin noticed a prolonged period of band riding along the upper band. By maintaining their position and adjusting their stop-loss levels, they maximised profits until the crossover below the lower band indicated a clear reversal.
These case studies underscore the practical application of Bollinger Bands, demonstrating how traders can adapt their strategies to market conditions and effectively use these indicators to enhance decision-making.
How Do Bollinger Bands Contribute to Risk Management During Trading?
Enhancing Risk Management Approaches with Bollinger Bands
Bollinger Bands enhance risk management in cryptocurrency trading by establishing clear support and resistance levels. By identifying these levels, traders can set stop-loss orders and target prices more effectively, minimizing potential losses during volatile market fluctuations. Here’s how to integrate Bollinger Bands into broader risk strategies:
1. Stop-Loss Implementation: Use the lower Bollinger Band as a guideline for setting stop-loss levels. If the price approaches this band, traders can tighten their positions to safeguard their investments.
2. Profit Targeting: Similarly, the upper band can act as a target point for profit-taking. When prices are near this level, traders can assess potential reversal signals for timely exits.
3. Awareness of Market Volatility: The dynamic nature of Bollinger Bands offers insights into market volatility, allowing traders to adjust their risk exposure appropriately.
4. Position Sizing: Understanding the volatility indicated by the bands helps traders determine suitable position sizes, ensuring they do not overexpose themselves to risk.
By effectively incorporating Bollinger Bands into risk management strategies, traders can navigate the unpredictability of crypto markets, safeguarding their investments while still capitalizing on opportunities.
Techniques to Improve Trading Accuracy with Bollinger Bands
Utilizing Bollinger Bands can significantly enhance trading accuracy by providing visual cues for entry and exit points based on statistical measures of volatility. Here are several strategies to improve trading accuracy with Bollinger Bands:
1. Timing Entries and Exits: Traders can leverage the interaction between price and the bands to optimize their entry and exit timing. For example, entering a position when the price touches the lower band and shows signs of reversal can lead to more favorable outcomes.
2. Confirmation from Additional Indicators: Merging Bollinger Bands with other indicators like MACD or volume can validate signals, reducing the likelihood of false entries or exits.
3. Regular Monitoring and Adjustments: Continuously monitoring the bandwidth and price behavior allows traders to adapt their strategies based on current volatility conditions, ensuring they remain flexible.
4. Practising Patience: Waiting for clear signals—such as a confirmed breakout above or below the bands—can prevent impulsive decisions and enhance overall trading success.
By emphasizing these strategies, traders can refine their methodologies, fostering greater accuracy and confidence in their trading decisions, ultimately leading to enhanced returns in the dynamic crypto market.
Long-Term Advantages of Consistent Use of Bollinger Bands
Consistent application of Bollinger Bands in crypto trading can yield several long-term benefits, promoting disciplined trading practices and enhancing market adaptability. Here’s how traders can benefit over time:
1. Improved Trend Recognition: Regularly utilizing Bollinger Bands helps traders identify trends and market conditions more effectively, enabling them to adapt strategies based on prevailing trends.
2. Informed Decision-Making: By relying on data-driven approaches, traders cultivate a disciplined mindset that minimizes emotional decision-making and fosters consistency.
3. Enhanced Risk Management: Long-term usage encourages a deeper understanding of risk management techniques, improving traders’ ability to navigate market volatility effectively.
4. Building Confidence: As traders become more adept at employing Bollinger Bands and experiencing success, their confidence in trading decisions naturally increases, leading to better overall performance.
By mastering Bollinger Bands and integrating them into their trading strategies, traders can cultivate long-term advantages that significantly enhance their overall trading experience and success.
Proven Techniques for Effectively Utilizing Bollinger Bands in Cryptocurrency Trading
Combining Bollinger Bands with Additional Indicators for Superior Results
Integrating Bollinger Bands with other indicators can create robust trading strategies that enhance signal accuracy in crypto trading. Here are effective strategies for marrying Bollinger Bands with other technical tools:
1. Bollinger Bands and RSI: Use Bollinger Bands alongside the Relative Strength Index (RSI) to confirm overbought and oversold conditions. For instance, if the price approaches the upper band while the RSI exceeds 70, it may indicate a potential price reversal.
2. Moving Averages: Pairing Bollinger Bands with moving averages facilitates clearer trend identification. When a short-term moving average crosses above the upper band, it may signal a strong upward trend.
3. MACD Integration: Utilizing the Moving Average Convergence Divergence (MACD) alongside Bollinger Bands can help identify potential trend reversals. A bullish MACD crossover near the lower band may suggest a buying opportunity.
4. Volume Indicators: Incorporate volume analysis to validate the strength of moves indicated by Bollinger Bands. An increase in volume during a price breakout suggests a higher probability of trend continuation.
By employing these combinations, traders can significantly enhance their market analysis and make better-informed decisions, ultimately improving their overall trading outcomes.
How to Optimize Trade Timing Using Signals from Bollinger Bands?
Effectively timing trades using Bollinger Band signals involves understanding how the price interacts with the bands to pinpoint optimal entry and exit points. Here’s a systematic approach to trade timing:
1. Recognizing Breakouts: Watch for price breakouts above the upper band or below the lower band. A confirmed breakout presents an ideal moment to enter a trade, particularly if supported by additional indicators.
2. Awaiting Confirmation: Avoid entering trades solely based on a price touch of the bands. Instead, seek further confirmation, such as a bullish engulfing pattern for upper-band breaches or a bearish pattern for lower-band interactions.
3. Implementing Stop-Loss Orders: Set stop-loss orders placed just outside the bands to manage risk effectively. If the price moves against the position, these orders can help limit losses.
4. Assessing Market Context: Consider the overall market context and sentiment before timing trades. Economic news, market trends, and trading volume can substantially influence the efficacy of band signals.
By applying these strategies, traders can improve their timing and execution, maximizing their potential returns within the rapidly fluctuating crypto landscape.
How to Adjust Strategies in Response to Evolving Market Conditions?
Adapting trading strategies to changing market conditions is crucial for effectively utilizing Bollinger Bands. Here’s how traders can remain relevant and effective:
1. Modifying Band Parameters: Adjust the SMA periods and standard deviation multipliers based on current market volatility. During heightened volatility, consider increasing the SMA period to reduce false signals.
2. Monitoring Market Sentiment: Stay attuned to market sentiment and news affecting the crypto landscape. Rapid price movements may necessitate adjustments to strategy and increased caution.
3. Utilizing Different Timeframes: Analyse Bollinger Bands across various timeframes to capture diverse market dynamics. Shorter timeframes can reveal immediate opportunities, while longer timeframes provide insights into broader trends.
4. Regularly Reviewing Performance: Continuously evaluate the effectiveness of strategies based on changing market conditions. Implementing a consistent review process can help refine approaches over time.
By embracing adaptability, traders can ensure their strategies remain relevant amid changing market dynamics, ultimately improving trading performance and risk management.
Common Challenges Encountered When Using Bollinger Bands
Critical Misinterpretations to Avoid When Using Bollinger Bands
Misinterpreting Bollinger Band signals is a frequent challenge that can lead to costly trading errors. Here are crucial misinterpretations to avoid:
1. Assuming Breakouts Guarantee Movement: Traders often mistakenly believe that a breakout above or below the bands will inevitably lead to continued price movement. False breakouts can mislead traders into premature entries or exits.
2. Overlooking Market Context: Ignoring the broader market context, such as news events or macroeconomic factors, can lead traders to make uninformed decisions based solely on band signals.
3. Neglecting Volume Dynamics: Failing to consider volume during band interactions may result in missed signals. Increased volume during a breach indicates stronger trends, while low volume might suggest weak price movement.
4. Using Bands in Isolation: Relying solely on Bollinger Bands without corroborating indicators can lead to skewed interpretations. Incorporating multiple indicators enhances accuracy and reduces potential errors.
By acknowledging these misinterpretations and maintaining a comprehensive approach, traders can decrease the likelihood of unnecessary losses and enhance their decision-making.
When Is It Appropriate to Adjust Your Bollinger Band Settings?
Adjusting Bollinger Band settings is essential when market conditions change. Here are scenarios that warrant adjustments to band parameters:
1. Increased Market Volatility: During periods of heightened volatility, consider increasing the SMA period or standard deviation multiplier to smooth out price data and minimize false signals.
2. Shifts in Market Sentiment: If market sentiment shifts dramatically, reevaluate the current settings. Bullish sentiment may necessitate tighter bands, while bearish sentiment might require broader bands.
3. Seasonal Patterns: Certain cryptocurrencies may exhibit seasonal trading patterns influenced by market cycles. Adjusting the bands based on historical performance can help capture these trends more accurately.
4. Performance Reviews: Regularly assess trading performance and success rates. If signals from Bollinger Bands frequently lead to losses, it may be time to reconsider and adjust the settings.
By proactively adjusting band settings, traders can enhance the effectiveness of Bollinger Bands and improve their adaptability to shifting market conditions.
Integrating Bollinger Bands into a Comprehensive Trading Strategy
Incorporating Bollinger Bands into an overarching trading strategy is essential for creating a cohesive approach that enhances market engagement. Here are key considerations for successful integration:
1. Defining Clear Objectives: Establish specific trading goals and align Bollinger Band usage with these objectives. Whether focusing on short-term gains or long-term investments, clear goals help tailor strategies accordingly.
2. Incorporating Risk Management: Use Bollinger Bands as part of a broader risk management plan. Setting stop-loss orders based on band interactions facilitates effective capital protection.
3. Regularly Reviewing Trading Plans: Continually assess and adjust trading plans based on market conditions and performance metrics. This ensures that strategies remain relevant and effective over time.
4. Holistic Market Analysis: Integrate Bollinger Bands with other analytical tools and indicators to create a comprehensive market analysis approach. This holistic view enhances decision-making and mitigates risks.
By seamlessly incorporating Bollinger Bands into a comprehensive trading strategy, traders can develop a more robust strategy that enhances their engagement with the crypto market while effectively managing risk.
Accurately Identifying Trend Reversals with Bollinger Bands
In the volatile world of crypto markets, accurately identifying trend reversals using Bollinger Bands is crucial for successful trading. Here are strategies to differentiate genuine reversals from false signals:
1. Watch Band Interactions: Keep an eye on price interactions with the upper and lower bands. If the price consistently reflects upward momentum off the lower band, this could indicate a potential reversal.
2. Confirm with Additional Indicators: Utilize complementary indicators such as RSI or MACD to validate reversal signals. For example, a price breach below the lower band coupled with an RSI divergence can signal a strong buying opportunity.
3. Monitor Volume Trends: Increased trading volume during a reversal can signify stronger conviction behind the price move. This volume confirmation strengthens the reliability of the reversal signal.
4. Evaluate Market Context: Assess the broader market context when identifying reversals. Major news events or shifts in market sentiment can significantly impact price movements, making it vital to consider the overall environment.
By employing these strategies, traders can more accurately identify trend reversals, leading to timely and profitable trading decisions.
Implementing Effective Risk Management Techniques Using Bollinger Bands
Effective risk management is paramount when applying Bollinger Bands in crypto trading. Here are techniques to safeguard investments against unexpected volatility:
1. Setting Dynamic Stop-Losses: Utilize dynamic stop-loss orders based on band interactions to protect investments. For instance, set a stop-loss just outside the upper band when entering a long position to minimize potential losses.
2. Position Sizing: Determine appropriate position sizes based on band width and market volatility. Adjust sizes to align risk tolerance with potential gains, ensuring a balanced approach.
3. Diversifying Strategies: Avoid concentrating all capital on a single trade influenced solely by Bollinger Bands. Diversify strategies across multiple crypto assets to reduce exposure to any single market’s movements.
4. Regular Review and Adjustment: Continuously assess trading performance and modify risk management strategies based on outcomes. This iterative process enhances decision-making and improves the effectiveness of overall risk management.
By implementing these risk management techniques, traders can navigate the unpredictability of crypto markets with greater confidence, safeguarding their investments while capitalizing on opportunities.
Frequently Asked Questions About Bollinger Bands in Trading
What Are Bollinger Bands and What Function Do They Serve?
Bollinger Bands are a volatility indicator utilized in trading, consisting of a middle band (SMA) and two outer bands. They assist traders in identifying potential overbought or oversold conditions by measuring price levels in relation to standard deviations.
How Can I Effectively Apply Bollinger Bands in Cryptocurrency Trading?
To effectively use Bollinger Bands, observe price movements in relation to the bands, look for squeezes that indicate potential breakouts, and consider entering or exiting trades based on band interactions and confirmation from other indicators.
What Does a Bollinger Band Squeeze Indicate?
A Bollinger Band squeeze signifies periods of low volatility, often preceding significant price movements. Traders interpret this as an opportunity to prepare for potential breakouts or reversals.
Are Bollinger Bands Compatible with Other Indicators?
Yes, Bollinger Bands can be effectively combined with other indicators such as RSI, MACD, and moving averages to enhance signal accuracy and confirm trading decisions.
How Do I Adjust My Bollinger Band Settings?
Adjust Bollinger Band settings based on market volatility—consider changing the SMA period or standard deviation multipliers depending on current market conditions and your trading strategy.
What Common Mistakes Should I Avoid When Using Bollinger Bands?
Common mistakes include misinterpreting signals, relying solely on the bands without additional indicators, and failing to consider the broader market context. Awareness of these pitfalls can enhance trading effectiveness.
How Do Bollinger Bands Assist in Risk Management?
Bollinger Bands facilitate risk management by establishing clear support and resistance levels, allowing traders to set informed stop-loss orders and target prices to minimize potential losses during market volatility.
Are Bollinger Bands Suitable for All Cryptocurrencies?
Bollinger Bands can be applied to various cryptocurrencies; however, their effectiveness may vary based on an asset’s volatility and market behavior. Traders should tailor their strategies accordingly.
What Strategies Can I Employ to Boost Trading Accuracy with Bollinger Bands?
Boosting trading accuracy involves using Bollinger Bands alongside other indicators, waiting for confirmation signals, and continuously reviewing and adjusting strategies based on performance.
What Is the Optimal Time Frame for Using Bollinger Bands?
The optimal time frame for using Bollinger Bands depends on individual trading strategies. Shorter time frames may suit day traders, while longer time frames benefit swing traders and long-term investors.
Connect with Us on Facebook!
The Article Bollinger Bands in Crypto Trading: A Beginner’s Guide Was Found On https://limitsofstrategy.com