Page speed is one of the factors which determines whether you get a good ranking in Google. Page speed is a ranking factor, and its importance keeps growing. In this post, we’ll discuss how to check your page speed and which tools can help you do just that. Read on!
Why is page speed important for SEO?
For starters, a fast website provides a much better user experience than a slow one. Research has shown time and again that people don’t buy as much from slower sites. They also don’t read or engage as much on slow sites. That in itself should be enough reason to make sure the speed of your web pages is as good as it can be.
Beyond just being better for users, faster websites can be easier for search engines to crawl, process and index. That means your posts will take less time to show up in the search results. And they’ll be more likely to perform and rank better.
Page speed is not a single metric
We’ve written an extensive post about the concept of page speed and its importance. Long story short, page speed is not a single metric. You should not think of page speed as in “this page loads in 5 seconds”.
This is due to the complexity of various factors that affect the loading speed of a web page. Some of these factors include the infrastructure of your web server, the quality of the internet connection of your users, and the technical setup of your website (i.e: themes, plugins). And it’s not possible to determine the definitive loading speed of a page either.
Even if you try to simplify all of this to something like “the time it takes until it’s completely loaded“, it’s still tricky to give that a useful number. For instance, you can run an analysis that shows you that your page loads in 5 seconds. But this number may only apply to a percentage of your users. Someone who lives further from your web server, with a slower internet connection, and uses a slower device will experience a longer load time.
Instead, we advise you to think of page speed as a part of the user experience that your website provides. Page speed and user experience go hand-in-hand.
Make a page “feels” like it loads faster
In an ideal world, we’d click on a link in the search result page and the web page would appear instantly before our eyes. But we all know that our technologies haven’t reached that point yet. At the same time, websites nowadays are incredibly complex, with web pages getting heavier and harder to load.
Now, the challenge for website owners is not only to make pages load faster, but also to give visitors the “perception” that the page is indeed fast. In fact, being able to deliver the “perception” that a page is fast is crucial, as it ties into the “experience” that visitors get on your website. In order to create this “perception” of a fast-loading page, it’s good to get a grasp of the loading process of web pages.
Web page loading process 101
From the moment when you click on a link or hit ‘enter’ in your URL bar, a process begins to load the page you requested. That process contains many parts, but they can be grouped into several stages which look something like this:

Please note that the above model refers to the delivery and rendering of content above the fold. The model is also mobile-centric.
While Google’s documentation might be a bit ambitious about the timings of these stages, the model is helpful. Essentially, the process can be described in three stages of loading. Let’s discuss these three stages and what they mean to your pages.
Network stage
DNS lookup and TCP connection: Without going too much into detail, you can understand that these are protocols to establish communication between your web server and the user’s device. Essentially, they are what make transferring data via the internet possible.
Generally speaking, you don’t have a whole lot of control over what happens here. It’s also hard to measure or impact this part of the process. But it’s good to note that there are technologies that exist to speed up this process, including CDN, intelligent routing, etc. However, these technologies are more useful for sites that serve large international audiences. If you have a site that serves mostly local audiences, there are other things that you can do to speed up your pages.
Server response stage
HTTP request and response: After a connection is established, your user’s device sends a request to your web server asking for the page and its accompanying files and content. Your web server must process this request and prepare the requested content. Your hosting infrastructure, your web server, and the availability of a CDN have an impact on this stage.
Server response time: Server response time refers to the time it takes for a server to return the initial HTML, excluding the network transport time. This stage is about how fast your web server can return information. Your hosting infrastructure, web server, themes, and plugins can affect this stage.
Browser-rendering stage
Client-side rendering: This stage is where the page needs to be constructed, laid out, colored in, and displayed. The way in which images load, in which JavaScript and CSS are processed, and every individual HTML tag on your page affects how quickly things load. Themes and plugins also add additional elements to be rendered.
It’s good to realize that assets, content, and elements (i.e: buttons) on any given page are loaded in sequences. You can imagine that elements near the top of the page will be prioritized first, then elements closer to the bottom of the page will be loaded later on. This is also why Google emphasizes the importance of above-the-fold content in various documentation – it allows users to start interacting with a page as soon as possible. Additionally, being able to quickly load content on the top of a page also gives the perception that the page loads fast.
Metrics to pay attention to when checking page speed
Since 2021, Google introduced Core Web Vitals – a set of metrics to measure websites’ speed and user experience, which made their way into Google’s core algorithm update. Essentially, Core Web Vitals look at three aspects of a web page: loading performance, interactivity, and visual stability.
- Loading – Largest Contentful Paint (LCP): Measures how long it takes for the most significant piece of content to appear on the screen.
- Interactivity – First Input Delay (FID): Measures how fast the page can respond to the first user interaction.
- Visual Stability – Cumulative Layout Shift (CLS): Measures the stability of visual elements on your page. In other words, does stuff move around on the screen while loading?

When optimizing your page performance for SEO, these three metrics are the most important to look out for. To pass Core Web Vitals, you need your page to get a green “score” for all these three metrics. And it’s good to know that at least 75% of your real-world users need to experience the green “score” in order for your page to have a pass.
Google’s John Mueller said that all three metrics must appear green if you want your site to benefit from the page experience ranking signals. Note that you shouldn’t optimize your site to get green scores – but having green scores will be beneficial for your visitors. It’s all about happy visitors – and great content, of course!
Other interesting metrics
In addition to these three metrics, it might be interesting to also look at:
- Time to first byte (TTFB): Measures how long it takes until the server responds with some information. Even if your front-end is blazing fast, this will hold you up.
- First contentful paint (FCP): Measures how long it takes for key visual content (e.g., a hero image or a page heading) to appear on the screen.
- Time until interactive: Measures how long it takes for the experience to be visible, and react to user’s input.
All of the mentioned metrics are much more sophisticated metrics than “how long did it take to load”. And perhaps more importantly, they have a user-centric focus. Improving these metrics should correlate directly with user satisfaction, which is super important for SEO.
You can read more about these metrics in Google’s documentation.
Get practical: How to check your page speed
Now that you’ve got the basics about the concept of page speed and the web-loading process, it’s time to get practical and dive into the tools to check your page speed.
Your best friends are Google Search Console and PageSpeed Insights.
Google Search Console
Essentially, data regarding Core Web Vitals and other page performance metrics are taken from PageSpeed Insights. But we want to point you to Google Search Console (GSC) first before going into PageSpeed Insights.
Assuming that you’re working on improving your page speed to gain competitive advantages in search ranking, then you’re probably using Search Console a lot already. Not only does the tool give an overview of your search performance, but it also provides a great overview of how your pages perform according to the page experience standards.
To see this report, go to Google Search Console and look for “Page experience” in the left navigation bar. You should see an overview of how your mobile and desktop pages perform.

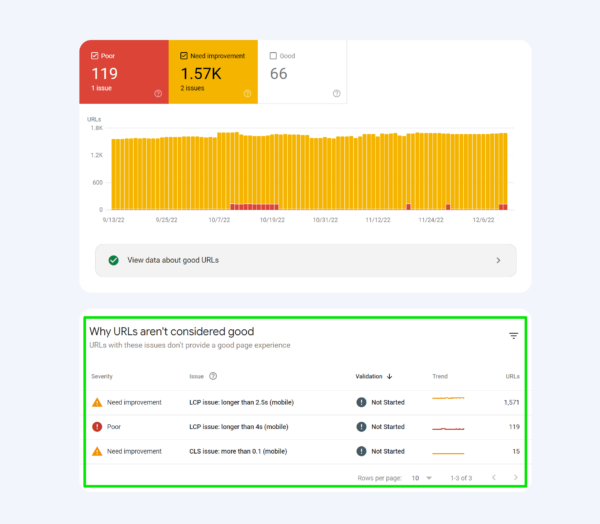
Take a look at the “Core Web Vitals” tab. There, you’ll find a list of URLs that are failing Core Web Vitals, which are conveniently grouped into categories that they are failing.
This is great because the tool presents you with an overview of the links you should work on. In addition, you already know beforehand what your objectives for these URLs are. For instance, you know whether you should work on improving the LCP or CLS score of a page.

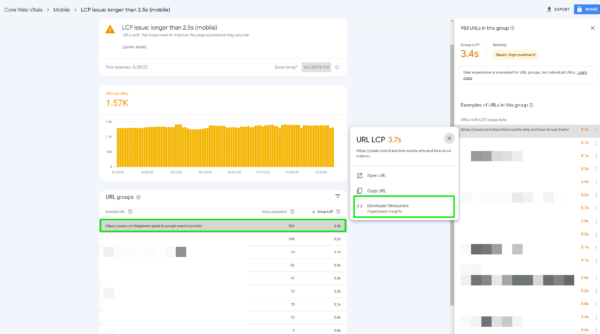
Clicking on one of these groups will prompt GSC to show you a few groups of URLs, based on their performance. For example, in the screenshot below, Search Console is showing URLs with low LCP scores, grouped based on the different LCP scores.

Clicking on one of these groups will show you the full list of URLs on your right bar. And if you click on an URL, a box will appear with a link that takes you to an audit of the page on PageSpeed Insights.
PageSpeed Insights
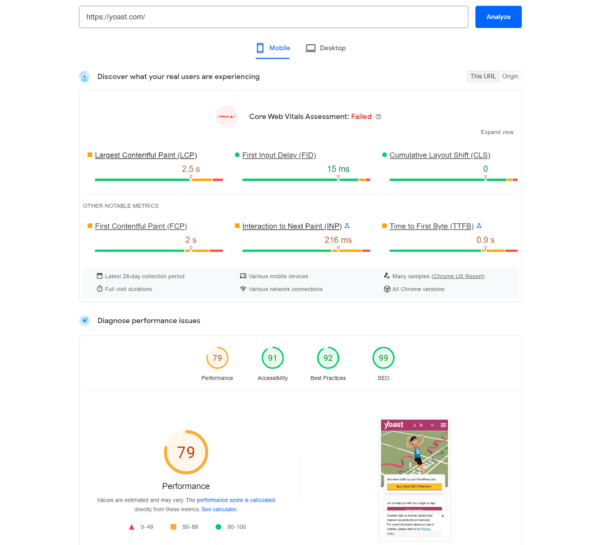
As we mentioned above, PageSpeed Insights provides you with data regarding your page performance. You’ll find metrics in Core Web Vitals and other metrics of a specific page.
This is an incredibly useful tool if you want to work on improving your page performance. It provides real user metrics of your website, straight from Google.

If you scroll down a bit, you’ll find a diagnostic that provides you with the causes of why your page is failing Core Web Vitals. The reasons listed here are unique to a page and can range from a redundancy of third-party code, JavaScript error, lack of caching, etc,…
The tool also provides suggestions to optimize your page, which you can find under the “Opportunities” section. They are good starting points and can be helpful when you’ve just started out with speed optimization. But it’s good to know that following these suggestions may help your page to load faster, but they might not directly affect the performance score. There are also a bunch of other things you could do other than what’s listed here.
More advanced tools
If you’re new to page speed optimization, then Google Search Console and PageSpeed Insights probably give you enough information to start working. This section is more useful for those who would like to have more data and want to dive deeper into their website’s performance.
Tools to check server performance
These tools focus on the performance of server hardware, databases, and scripts. You may need to ask for help from your hosting provider or tech team.
We can check the performance of the server with tools like NewRelic or DataDog, which monitor how your site behaves and responds from the ‘inside’.
They’ll provide charts and metrics around things like slow database queries and slow scripts. Armed with this information, you can get a better understanding of whether your hosting is up to scratch, and if you need to make code changes to your theme/plugins/scripts.
WordPress has some great plugins for doing this kind of analysis, too. We recommend checking Query Monitor out. It provides some great insights into which bits of WordPress might be slowing you down – whether it’s your themes, plugins, or environments.
Another tool to check page performance
Another tool that may be interesting to look at is WebPageTest.org. This tool lets you test how your page performs on various types of networks and devices.
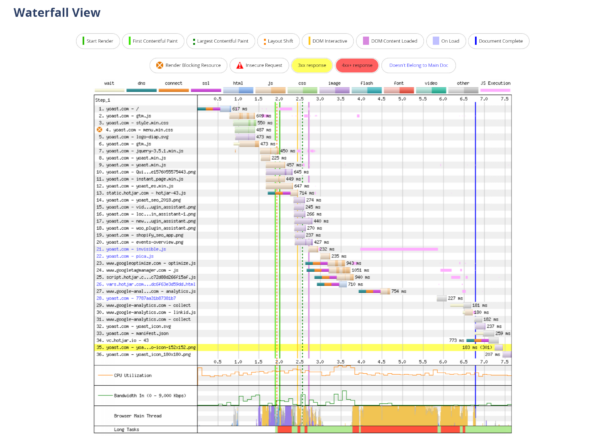
An interesting feature of this tool is the “waterfall” view. Essentially, it presents you with an overview of how much time it takes for all the assets on a page to load. This can be especially useful if you want detailed diagnostics to identify optimization opportunities.
For instance, the image below is the waterfall view of the homepage of Yoast.com. It looks quite daunting at first, but it does become easier to understand once you run the test yourself. Remember the model of the stages of the loading process we mentioned earlier? This waterfall view tells us that the first stage (DNS lookup and TCP connection) takes about 0.55 seconds to complete. Then the HTML file is sent from the web server to the browser (but not rendered) and then onto other assets.

Field data vs Lab data
Now that you’re equipped with the right tools to check your page speed, let’s talk about how these tools get their data.
Metrics in Core Web Vitals are measurable in the field and reflect the experience that your real-world visitors get. That’s why Google requires at least 75% of your real visitors to experience good page performance before giving you a pass. You can count on PageSpeed Insights to give you field data from real users.
In contrast, a tool like WebPageTest.org runs tests and collects data within a controlled environment, with predefined devices and network settings.
We know and understand the importance of field data since it captures true real-world user experience. It helps you to understand what your users struggle with. However, with field data, you run into the issue that you have limited debugging capabilities. Since every user is different, it’s hard to pinpoint exactly whether the changes you deploy are effective or not.
On the other hand, with lab tests, you can control for as many factors as you can, so the results are consistent and reproducible. And since field data is captured from real-world experience, it can only do so if users are able to enter and load your page. Lab data can help with identifying optimization opportunities and help make your site more accessible to a wider range of audience. Let’s say your goal is to optimize your site so users with a really slow connection can still access it. Running lab tests may give insights into what you can do to improve.
Which to prioritize?
Generally speaking, if you have both field and lab data on a page, you should prioritize using field data and base your optimization efforts on that. That means looking at the data in Google Search Console and PageSpeed Insights. Google also recommends prioritizing field data. Since field data reflects the experience real-world users get, you can better understand what issues they are facing and what you need to do to fix those.
Wrap up
Learning how to check your page speed doesn’t need to be difficult. If you’re just starting out with page speed optimization, look to Google Search Console and PageSpeed Insights. These tools will give you insights into which pages are falling Core Web Vitals and how real users experience your page.
From there, identify what your pages are lacking and focus your effort on optimizing your pages to pass Core Web Vitals. The suggestions that Google gives on PageSpeed Insights may provide you with a good starting point. However, don’t rely on them all the time. There is so much more you can do!
Did we miss anything in this post? Or do you have great tips on page speed optimization? Let us know in the comment!
The post How to check page speed: tools and suggestions appeared first on Yoast.


Recent Comments