
Ever wonder who’s looking at your profile on LinkedIn? Or how effective your company’s page is at generating leads? With the power of LinkedIn analytics, you can track, measure, and optimize your LinkedIn data to improve your personal brand or business page.
In this guide, we’ll cover how to access LinkedIn analytics, important LinkedIn metrics to focus on, and how to interpret the data. Plus, we tapped two social media experts for insider tips on how to take your marketing efforts to the next level.
Key Takeaways
- LinkedIn analytics provide detailed data on profile visitors, content performance, and audience demographics. You can use these insights to tailor your content strategy and improve engagement on the platform.
- Use analytics to benchmark against competitors by comparing your performance. That way, you can adjust your strategy and identify opportunities for growth.
- Tools like Hootsuite Analytics can save time and provide deeper insights into your LinkedIn performance across multiple accounts.
What is LinkedIn analytics?
LinkedIn analytics is the data and statistics behind your LinkedIn activity. It provides valuable insight into who your audience is, how they’re interacting with your content, and the overall effectiveness of your social media strategy on the platform.
For example, you can use LinkedIn analytics to see how many people have viewed your profile, how well your organic and sponsored content was received, how many likes your last carousel post got, or the number of clicks your company page received in the past month.
Psstt: You can even get super granular and see where your visitors live, their job titles, and what industries they work in.
Bonus: Download a free guide that shows the 11 tactics Hootsuite’s social media team used to grow their LinkedIn audience from 0 to 278,000 followers.
Why do LinkedIn analytics matter?
If your company is active on LinkedIn, here’s why tracking LinkedIn analytics matters for your social marketing strategy:
- Understanding follower demographics: When you know who your audience is, you can tailor your content to them. LinkedIn analytics can tell you where your followers are based, what industry they work in, and their role.
- Audience growth: Once someone engages with one of your LinkedIn posts, they’re more likely to see more of your content in their algorithm. This is why tracking your audience growth is important—so you can understand if your content is reaching people.
- Generate leads: LinkedIn is a lead generation machine if you can reach the right audience. By using analytics, you can see what type of content your audience interacts with and use that insight to generate more leads.
- Compare to the competition: Want to see how your page compares to your competitors? You can use LinkedIn analytics to compare engagement and follower metrics and see what similar businesses are posting.
- Track employee advocacy: Employee advocacy—when employees promote their company on social—is essential if you want to increase brand awareness, improve your reputation, or share thought leadership. If you’ve started an employee advocacy program, tracking your analytics will tell you if it’s effective.
21 key LinkedIn analytics metrics to track
There are countless LinkedIn metrics available to marketers. But does that mean you should be tracking, monitoring, and reporting on them all?
Nope! That’s a lot of data.
Which LinkedIn metrics you should track depends on the social media goals you set.
For example, if your brand is trying to engage new audiences through its published posts, keep an eye on content analytics. If you want to grow brand awareness on the platform, track follower and visitor analytics.
If you’re brand new to monitoring LinkedIn metrics, start simple. Here are some basic metrics you should be tracking:
LinkedIn profile metrics
- Page views: The total number of times your page was visited.
- Post views: The total number of views your posts, documents, or articles have received. You can also dive deeper for a post-by-post breakdown and to see insights like reactions, comments, and share details.
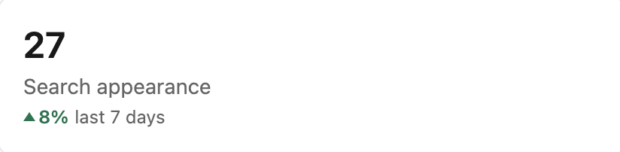
- Search appearances: The number of times your profile appeared in search results during a given period.
LinkedIn content metrics
- Post impressions: This metric lets you know the total number of times your LinkedIn post is visible for at least 300 milliseconds, with at least 50% in view to a user logged into LinkedIn.
- Unique impressions: This is the number of times your post displays to unique signed-in members. Unlike impressions, unique impressions won’t count when a user sees the same post multiple times.
- Reactions: LinkedIn Reactions are used to display different emotional responses to your content. Users can select emojis to show that they like, celebrate, support, love, find insight, or feel curious about the content you share.
- Comments: Comments are the number of user comments left underneath your post.
- Reposts: This metric indicates the number of times a user decides to share your content with their own LinkedIn following, expanding your post’s reach.
LinkedIn follower and demographic metrics
- Total followers: The total number of current followers your business page has.
- Follower metrics: This shows how the number of your brand’s followers has increased (or decreased) over a set amount of time.
- Follower demographics: This metric breaks down who’s following your page by categorizing them into industries, seniority levels, and locations.
- All followers: Use this list to keep tabs on your biggest fans, and don’t forget to reach out with incentives to keep them engaged.
- Visitor highlights: This metric shows the number of total page views, unique visitors, and custom button clicks in the last 30 days
- Visitor demographics: Understanding the job, company size, industry, location, and seniority of your visitors can help inform your content strategy and unlock emerging markets.
LinkedIn engagement metrics
- Engagement rate: LinkedIn calculates engagement rate by adding the number of interactions, clicks, and new followers acquired, divided by the number of impressions the post receives.
- Clicks: Clicks are counted when a signed-in member clicks on your post, company name, or logo. It does not include other interactions like shares, reactions, or comments. A click tells you your call-to-action worked.
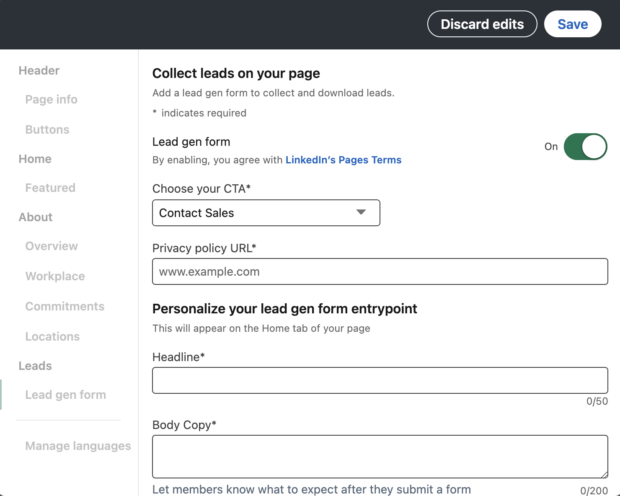
- Leads: Allows you to download data about leads collected through your page. You need to have a lead gen form set up to track this metric.
LinkedIn competitor metrics
- Follower metrics: Compares all-time followers and new followers gained within the specified time range. Metrics can be negative if unfollows exceed new followers. The metric is compared next to the competitor Pages you want to track.
- Total post metrics: Compares total post updates in the last 30 days and the percentage change compared to the previous 30 days.
- Total engagement metrics: Compares total engagements (reactions, comments, and shares) in the last 30 days.
- Trending competitor posts: Standout posts from the Pages you want to compare your content with.
How to create a LinkedIn analytics report using LinkedIn
Now that you know which LinkedIn analytics to track, it’s time to start creating reports.
You can create five types of reports for each of the five native LinkedIn analytics types. They are:
- Content reports
- Visitor reports
- Follower reports
- Lead reports
- Competitor reports
To create a LinkedIn analytics report, follow these steps:
1. First, navigate to your LinkedIn page.
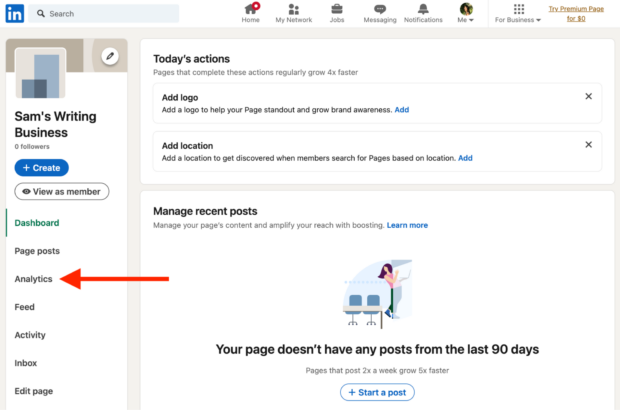
2. Next, choose the Analytics tab and navigate to the tab you want to generate a report from (content, visitors, followers, leads, or competitors).
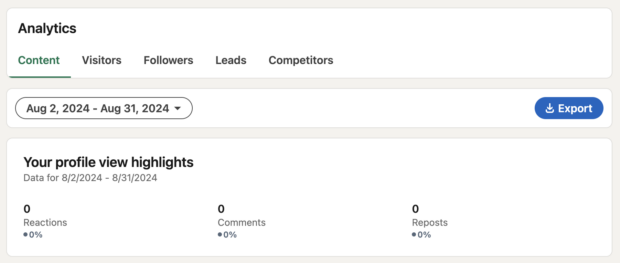
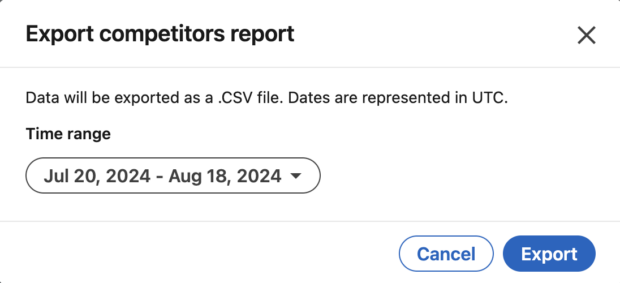
3. On the upper right side of the screen, you’ll see an Export button. Choose the timeframe you’d like the report to cover, and click Export.
How to create a LinkedIn analytics report using Hootsuite
Hootsuite users can use Hootsuite Analytics to generate eight different types of LinkedIn analytics reports.
These include:
- LinkedIn overview reports
- LinkedIn personal post reports
- LinkedIn audience report
- LinkedIn engagement report
- LinkedIn overview: Paid and organic report
- LinkedIn ads awareness
- LinkedIn ads consumption
- LinkedIn ads intent
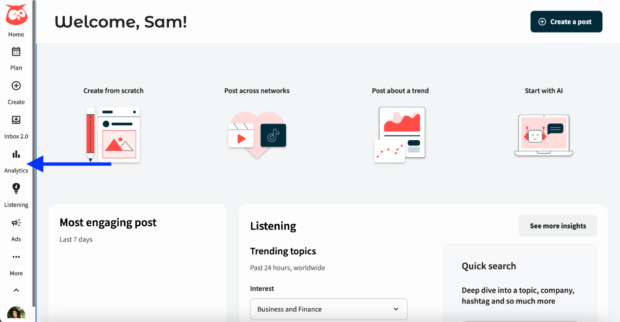
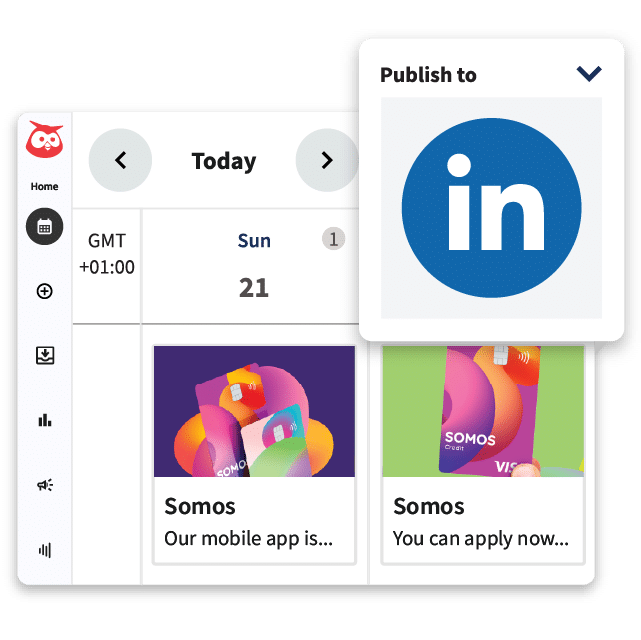
To generate a LinkedIn analytics report using Hootsuite, start by logging into your Hootsuite dashboard. Next, choose the Analytics button from the left-hand menu.
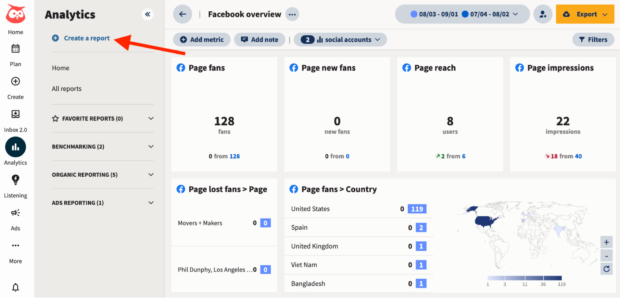
Then, select Create a report.
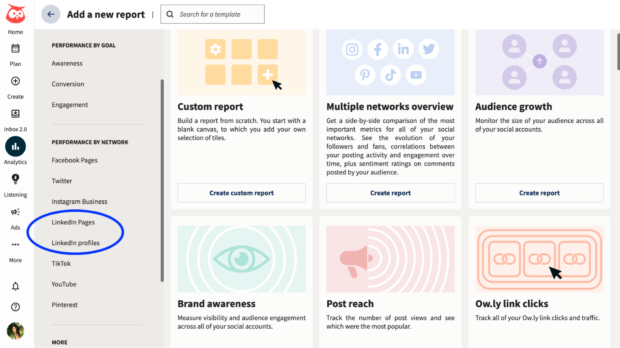
Now, select either LinkedIn Pages or LinkedIn profiles to use one of Hootsuite’s reporting templates for those categories.
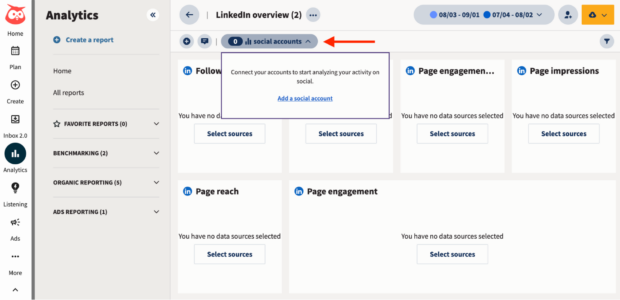
Choose the type of report you want to generate, then click Create Report. Make sure your LinkedIn page or profile is connected by selecting it from the social account dropdown menu.
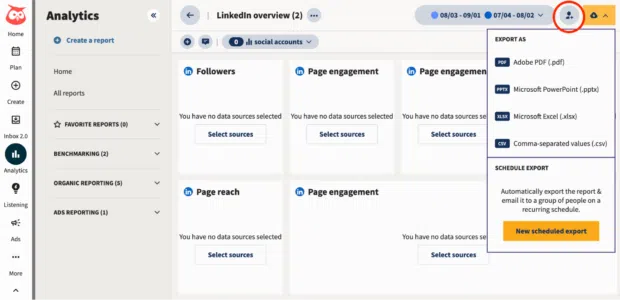
If you want to share your report, click on the Share with teammates button in the top right corner. You can also export your report as a PDF, PowerPoint, Excel, or CSV using the Export button in the top right.
4 best LinkedIn analytics tools for 2024
1. Hootsuite Analytics
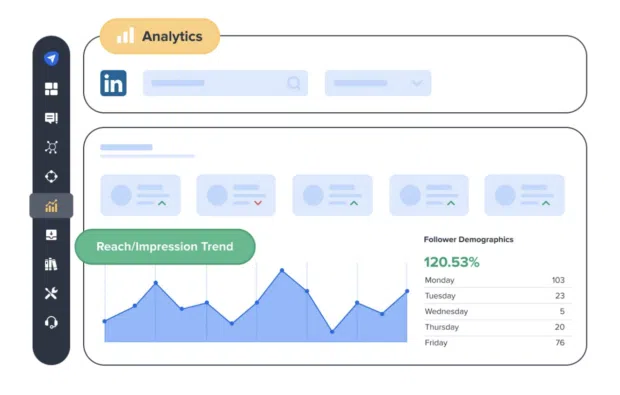
If your company has accounts on several social media platforms, Hootsuite Analytics can make your job a lot simpler.
Connecting your LinkedIn account to Hootsuite lets you schedule posts in advance and at optimal times, but that’s not all. You can also measure how your LinkedIn analytics compare to your other social metrics.
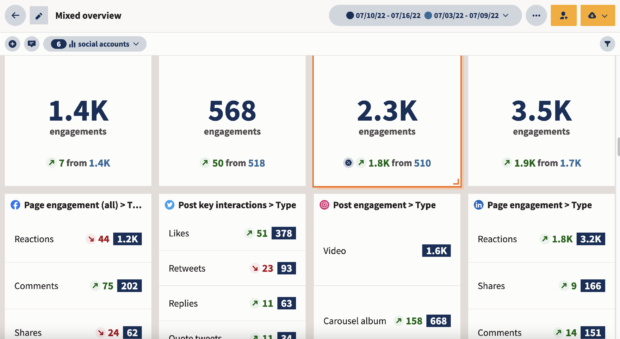
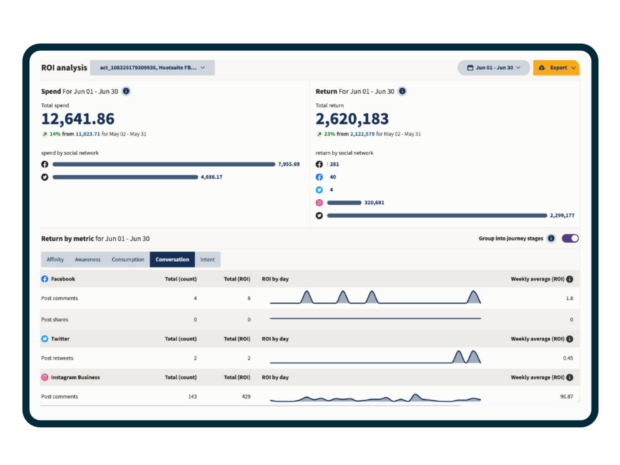
One of the best aspects of using Hootsuite Analytics for your business is the reporting features. As we outlined earlier, Hootsuite offers more than eight custom reports—for both organic and paid engagement—that make it easy for you and your team to see how your LinkedIn marketing strategy efforts are paying off.
Key features:
- Track, monitor, and compare metrics for your brand’s multiple social accounts from one place.
- Set performance benchmarks, making it easier to work toward your goals.
- Create customizable, clear-to-read reports that are easy to share with your team.
Price: Plans start at $99 per month.
Best for: Social media marketers who manage multiple social media platforms and want to access insights in one place.
#1 for LinkedIn marketing
Schedule posts, answer messages, and manage ads from one spot. Then, show off your results in beautiful reports. It’s so easy.
2. Hootsuite Insights
Looking to get deeper insights about your LinkedIn audience?
Advanced social listening tools like Hootsuite Insights (available to Hootsuite Enterprise plans) help you monitor ongoing conversations about your brand.
This tool tells you a ton about your LinkedIn audience—and how they feel about you. In particular, it helps you “hear” what people say about your brand on social media. You can use Insights to track mentions, highlight trends, and join important conversations.
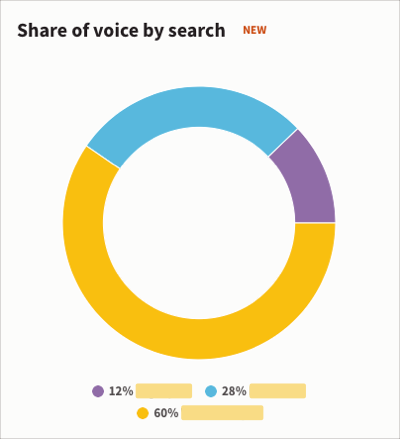
You can also measure your share of voice, which can help you see where you stand as an expert in your industry. If your brand plans to create more thought leadership content on LinkedIn, this is a critical metric to track.
Key features:
- Advanced social listening and sentiment analysis
- Data visualization to see sentiment
- Competitive metrics to compare your page with competitors
Price: Start your 30-day free trial or request pricing here.
Best for: Large social teams seeking deeper insights into brand sentiment and content analysis.
3. SocialPilot
SocialPilot is an AI-powered social media management tool that’s equipped with built-in content planning, scheduling, and analytics features.
For LinkedIn post analytics, SocialPilot can track and measure engagement, follower demographics, and reach—all of the metrics you’d find in LinkedIn’s native platform, but in one dashboard.
Key features:
- AI-powered scheduling, planning, and publishing for optimized posts
- Campaign tags for easy access and better organization
- Reports that can generate graphs and charts to visually communicate results
Price: Plans start at $25 per month.
Best for: Small businesses or marketing agencies looking for an easy-to-use social media scheduling tool with built-in analytics.
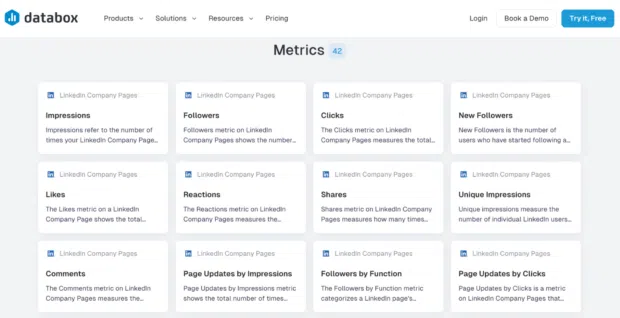
4. Databox
Databox is a dashboard and reporting software that teams can use to collect and analyze key business metrics in one place.
It works by integrating every platform your business uses—including LinkedIn and other social channels—to track and measure metrics that help you understand how your business is performing as a whole.
Key features:
- Can track 42 LinkedIn Company Page metrics
- Includes dashboard and reporting templates
- Easy-to-use dashboard that displays key business metrics in one place
Price: Get started for free. Paid plans start at $47 per month.
Best for: Data-driven marketing teams who want to track other business metrics outside of social channels.
3 LinkedIn analytics tips for best results
Looking to get the most out of your LinkedIn analytics? Follow these tips from two social media marketers for the best results.
1. Set clear goals
Like any social strategy, setting clear and manageable goals is essential.
It can take time to understand who your LinkedIn audience is and the type of organic content they engage with, so set clear but reasonable goals, suggests Jennifer Heimann, AVP, Marketing Strategy & Operations at L&L Collective.
“Realistic expectations are key!” says Heimann. “Slow, authentic growth is better than quick growth with people who aren’t interested in your content.”
2. Monitor employee engagement
According to Ibby Hussain, Vice President of Digital & Creative at Vested—a marketing agency for financial services where Hussain and her team manage over 30 LinkedIn profiles for brands and executives—the real game-changer for LinkedIn analytics is employee engagement.
“Employees are your most powerful advocates on LinkedIn, driving both engagement and reach,” says Hussain. “Even in a professional space like LinkedIn, photos with real people outperform corporate imagery.”
3. Prioritize on-platform engagement
Hussain suggests prioritizing content that keeps followers on your page and the platform.
“Prioritizing content that drives comments and interactions within LinkedIn, rather than linking out, will enhance both follower engagement and performance in LinkedIn’s algorithms,” she says.
One way to do this is by posting carousels. You can also write LinkedIn articles for thought leadership. Or, if you want to share links to your blog or another external site, include the link in the comments.
Easily manage your LinkedIn Page and all your other social channels using Hootsuite. From a single dashboard, you can schedule and share content (including video), reply to comments and engage your network. Try it free today.
Easily create, analyze, promote and schedule LinkedIn posts alongside your other social networks with Hootsuite. Get more followers and save time.
The post How to use LinkedIn analytics in 2024: A marketer’s playbook appeared first on Social Media Marketing & Management Dashboard.


Recent Comments