Email marketing analytics have evolved far beyond open rates and click-throughs. Today’s AI-powered analytics can predict which subscribers are most likely to convert, optimize send times for maximum engagement, and track every dollar of revenue back to specific campaigns.
![→ Download Now: The Beginner's Guide to Email Marketing [Free Ebook]](https://localseoresources.com/wp-content/uploads/2025/10/53e8428a-29a5-4225-a6ea-bca8ef991c19.png)
The difference between good and great email marketing often comes down to which metrics you track (and, more importantly, how you act on them). AI email marketing analytics transforms raw data into actionable insights, helping you understand what happened, why it happened, and what’s likely to happen next. Tools like HubSpot Marketing Hub have made this sophisticated analysis accessible through native dashboards and reporting features that automatically surface patterns human analysts might miss.
Whether analyzing predictive engagement scores or tracking complex revenue attribution paths, these AI-driven insights help you make smarter decisions faster. In this guide, I’ll explore five essential AI-powered metrics directly impacting your bottom line. Plus, you’ll learn what AI email marketing analytics tools to use and, most importantly, how to use these insights to create email campaigns that consistently drive revenue growth.
Table of Contents
- What is AI email marketing analytics?
- Pricing Comparison of AI Tools for Social Media Marketing
- AI Email Marketing Analytics Tools
- AI Email Marketing Metrics to Track
- How to Build AI Email Analytics Dashboards Your Team Will Actually Use
- Frequently Asked Questions (FAQ) About AI Email Analytics
What is AI email marketing analytics?
AI-driven email marketing analytics utilizes artificial intelligence and machine learning algorithms to automatically analyze email campaign data, predict subscriber behavior, and optimize marketing performance in real-time. Unlike traditional analytics, which report on past performance, AI-powered analytics identify patterns, predict future outcomes, and provide actionable recommendations to enhance engagement and drive revenue growth.
These advanced analytics systems measure predictive metrics, including:
- Engagement probability scores
- Optimal send times for individual subscribers
- Content performance patterns
- Deliverability trends
- Email revenue attribution
AI processes data points across subscriber interactions, email content, timing patterns, and conversion paths to uncover insights that would be impossible to detect manually.
Pricing Comparison of AI Tools for Social Media Marketing
|
Tool |
Best For |
Key Features |
Pricing |
Free Trial |
|
All-in-one marketing teams seeking integrated AI analytics with CRM |
Breeze Intelligence for predictive scoring Native AI dashboards and reporting Send time optimization Revenue attribution tracking Content intelligence analytics Automated lifecycle analytics |
Free: $0/month Marketing Hub Starter: $9/month/seat Starter Customer Platform: $9/month/seat Marketing Hub Professional: $800/month Marketing Hub Enterprise: $3,600/month |
Yes, 14 days |
|
|
E-commerce brands focused on revenue-driven email analytics |
Predictive CLV and churn risk AI-powered segmentation Benchmark reporting Revenue attribution Product recommendation engine |
Free: $0/month Email: $45/month Email + Mobile: $60/month |
No |
|
|
Enterprise companies with complex, multi-channel campaigns |
Predictive churn and purchase scoring AI content optimization Intelligent channel selection Custom prediction builder Real-time analytics |
Custom pricing only (see here) |
Yes, 14 days |
|
|
SMBs wanting advanced automation with AI insights |
Predictive sending Win probability scoring Content recommendations Attribution reporting Engagement scoring |
Starter: $15/month Plus: $49/month Pro: $79/month Enterprise: $145/month |
Yes, 14 days |
|
|
Small businesses starting with AI-powered email analytics |
Content optimizer Send time optimization Predictive demographics Smart recommendations Basic attribution |
Free: $0/month Essential: $13/month Standard: $20/month Premium: $350/month |
Yes, 14 days |
|
|
Budget-conscious teams needing multichannel AI features |
AI personalization Predictive analytics Send time optimization Engagement scoring Basic revenue tracking |
Free Tier: $0/month Standard Tier: $8/month Pro Tier: $9.60/month Enterprise: Custom pricing only (see here) |
No |
|
|
Data teams building custom AI analytics infrastructure |
Customer data platform Identity resolution Predictive traits Journey mapping 400+ integrations for AI tools |
Free Tier: $0/month Team Tier: $120/month Business Tier: Custom pricing only (see here) |
No |
AI Email Marketing Analytics Tools
1. HubSpot Marketing Hub
An all-in-one marketing platform with an integrated CRM, HubSpot transforms email marketing through its Breeze Intelligence AI, which analyzes millions of data points across your entire customer journey.
While other platforms focus on basic automation, HubSpot’s Breeze AI automatically tracks email revenue attribution, connecting every email interaction to closed deals and calculating true campaign ROI. HubSpot also powers send-time optimization, automatically determining the optimal delivery time for each subscriber. Its content intelligence analytics reveal which subject lines, CTAs, and content variations drive the highest engagement.
With Marketing Hub, you can build campaigns, analyze email performance, and see revenue impact through native dashboards that update in real-time.
Best for: Teams seeking integrated AI analytics with CRM data for complete revenue attribution.
Pricing
- Free: $0/month
- Marketing Hub Starter: $9/month/seat
- Starter Customer Platform: $9/month/seat
- Marketing Hub Professional: $800/month
- Marketing Hub Enterprise: $3,600/month
HubSpot Case Study
DoorDash transformed its merchant acquisition strategy using HubSpot’s marketing automation and integrated CRM to scale personalized outreach across email, landing pages, and lead nurturing workflows. “Over the course of the last year, we’ve shifted from 100 percent one-off campaigns to about 80% of our emails existing within workflows,” says Andrew McCarthy, Director of Content Marketing at DoorDash.
Additionally, Christopher Wise, Senior Manager, Retention Tech and Operations at DoorDash, said, “HubSpot honestly has the best UI out of any enterprise email service provider.” He continued, “It’s easy to understand. It makes sense — and you don’t need an entire team to execute within it.” Because of Marketing Hub, DoorDash was able to reduce the time required for its email campaign production process, segment audiences more efficiently, and facilitate faster collaboration between marketing and sales.
2. Klaviyo
Klaviyo, a B2C email CRM, uses generative and agentic AI to personalize, problem-solve, and create. While other e-commerce tools rely on historical data, Klaviyo’s AI technology uses real-time customer data insights to power your workflows, campaigns, and sign-up forms. Additionally, its K:AI customer agent answers your questions, recommends products, and (when needed) hands customer queries off to a live agent with full context.
Within Klaviyo, you can test predictions, set up campaigns, and measure performance through detailed analytics dashboards, all of which are enhanced with intuitive AI capabilities.
Best for: E-commerce brands maximizing customer lifetime value through predictive analytics.
Pricing
- Free: $0/month
- Email: $45/month
- Email + Mobile: $60/month
Klaviyo Case Study
Naturium, an e.l.f. Beauty brand used Klaviyo and its AI, K:AI, to encourage repeat purchases through targeted email campaigns, a loyalty strategy fueled by AI email marketing analytics, and triggered workflows. By syncing ecommerce, CRM, and loyalty data in Klaviyo, Naturium was able to unlock more integrated, accurate forecasting and analytics.
“It’s super helpful to have all our data centralized within Klaviyo,” said Giovanna Diez, Naturium’s Senior Manager of CRM and Loyalty. “I don’t have to worry about competing data points.” With Klaviyo’s AI email marketing analytics, tool integrations, and user-friendly CRM system, Naturium was able to keep up with nonstop information, growing customer profiles, and opportunities for increasing consumer loyalty.
3. Braze
Braze orchestrates personalized experiences using AI that predicts individual-level churn probability and purchase likelihood. Moreover, its Canvas Flow, with intelligent path optimization, automatically routes customers through the most effective journey based on real-time behavior and predictive scores. Plus, Braze’s AI technology (aka BrazeAI) drives meaningful engagement between marketing teams and consumers, all powered by predictive AI, agentic AI, and generative AI.
Within the platform, you can build predictions, orchestrate campaigns, and analyze performance through customizable dashboards.
Best for: Enterprise companies orchestrating complex, multi-channel customer journeys.
Pricing
- Custom pricing only (see here)
Braze Case Study
24S, LVMH’s digital luxury retailer, revolutionized and drastically improved its customer experience strategy by leveraging Braze to deliver personalized experiences in-app through abandoned cart and back-in-stock alerts. With the help of Braze’s AI Item Recommendations, 24S’s marketing team was able to design notifications with customized AI recommendations, thus maximizing purchase frequency. The result? A 7% increase in 24S’s add-to-cart rate and a 35% increase in their purchase conversion rate.
“By consolidating our tech stack and migrating to Braze, we were able to cut technology costs, reduce integration time, and limit technical complexity while delivering highly personalized experiences that our customers truly value,” said Carla Rota, Senior CRM Project Manager at 24S. Again, by utilizing AI-powered recommendations, the 24S team optimized and automated powerful customer experiences that resonate with its users. They also saved time, reduced complex workflows, and minimized campaign costs.
4. ActiveCampaign
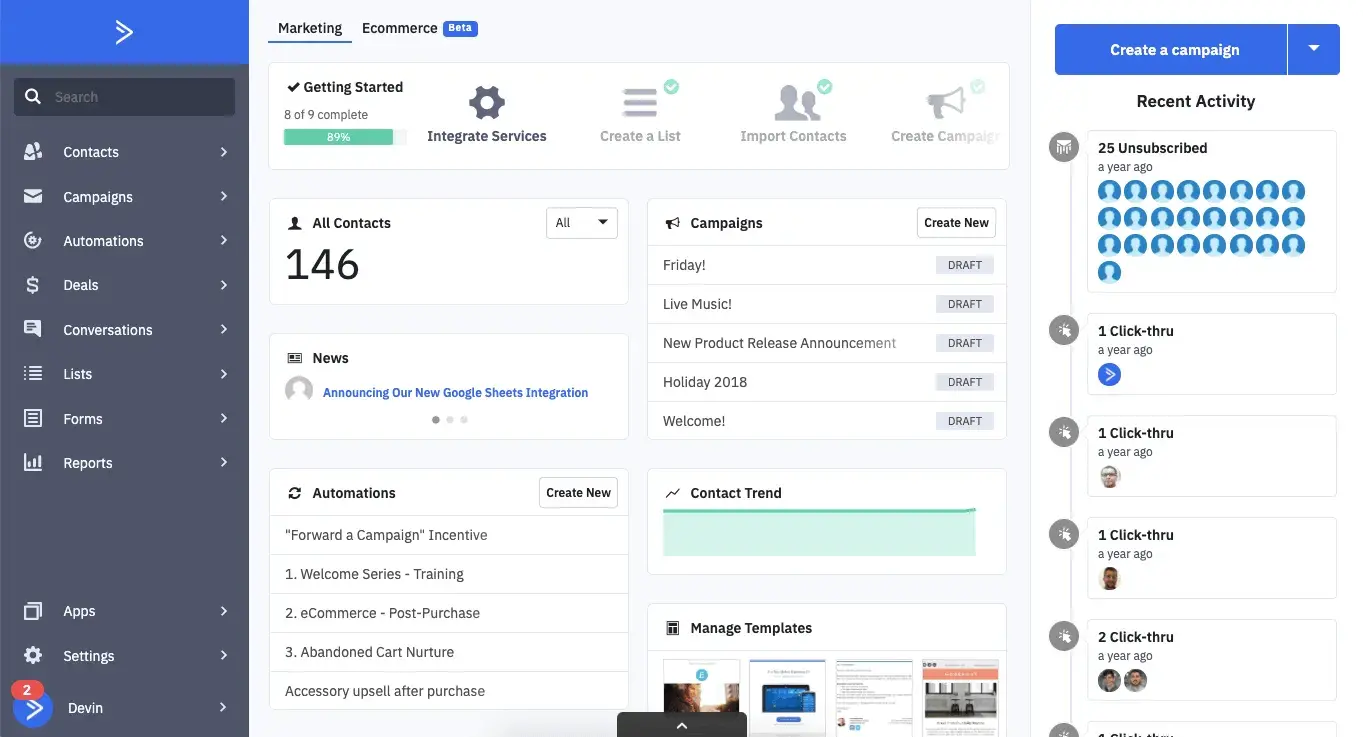
ActiveCampaign combines email marketing with AI-powered sales insights through predictive sending and win probability scoring. Using machine learning that analyzes engagement patterns across your entire database, it automatically determines the optimal send time for each contact and predicts which leads are most likely to convert.
ActiveCampaign’s AI technology creates instant first drafts, personalizes content based on contact data, and creates opportunities for 1:1 engagement with customers. Additionally, its AI powers content recommendations, suggests email templates based on past performance, and builds AI-optimized brand kits for easier and quicker email design.
Best for: SMBs combining email automation with AI-powered sales enablement.
Pricing
- Starter: $15/month
- Plus: $49/month
- Pro: $79/month
- Enterprise: $145/month
ActiveCampaign Case Study
The YMCA of Alexandria transformed its member engagement strategy by utilizing ActiveCampaign’s marketing automation and predictive sending features to streamline communications across programs, events, and fundraising initiatives. “ActiveCampaign’s AI Brand Kit made it super easy to pull in our logos and mission statement, and I no longer have to worry about adjusting fonts and colors every time I create an email,” said Adam Sakry, Digital Marketing Specialist for the YMCA of Alexandria.
The YMCA of Alexandria’s use of ActiveCampaign’s AI email marketing capabilities resulted in a 12.8% click-through rate, 27% average contact-list growth across all branches, and 10 hours saved. “Before we had these brand templates, I had to build every email myself. Now, anyone on our team can create an email that meets our brand standards,” Adam shared.
5. Mailchimp
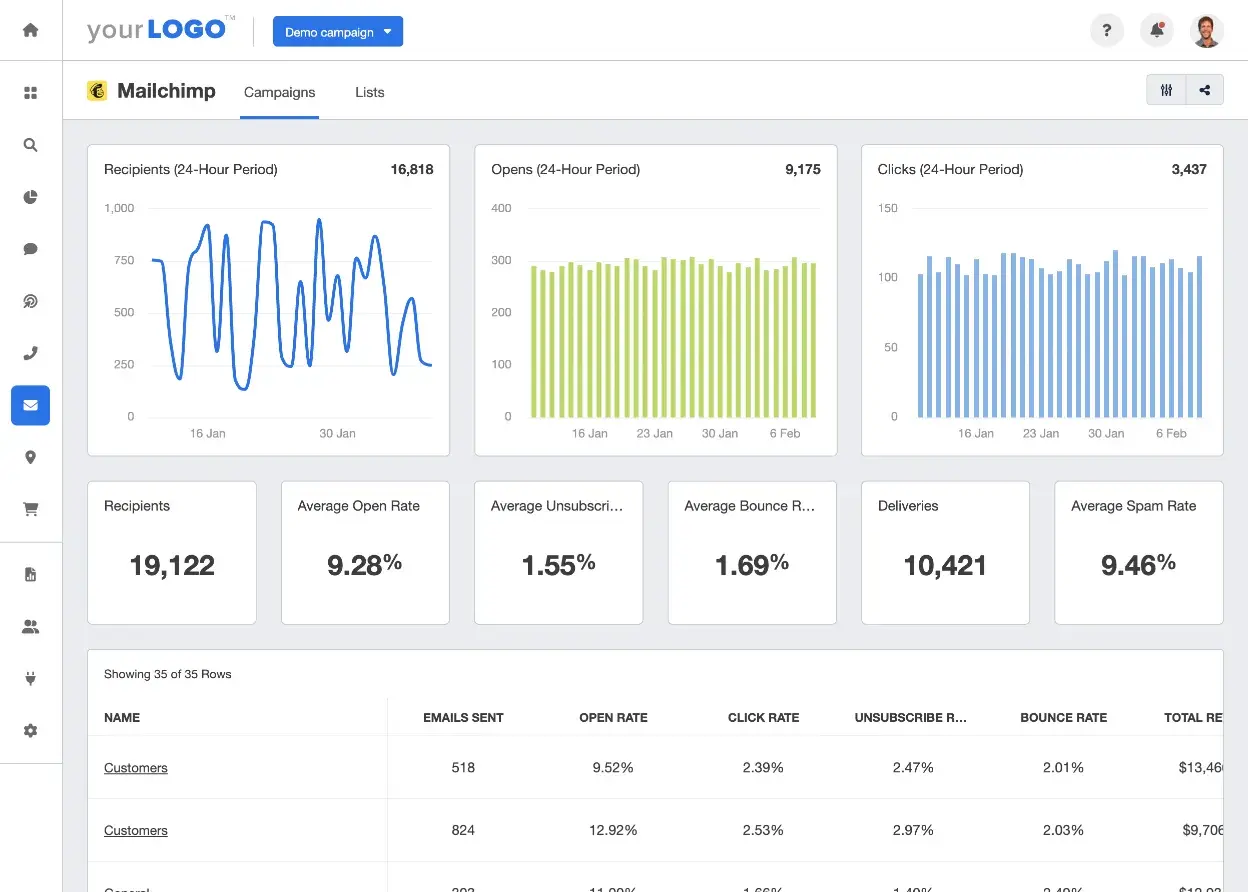
Mailchimp uses AI to optimize content and predict audience behavior through its Creative Assistant. Using content intelligence that analyzes millions of campaigns, Mailchimp automatically generates subject lines, recommends design improvements, and suggests optimal send times based on your audience’s behavior.
Additionally, Mailchimp’s AI technology creates personalized recommendations for subscribers, predicting demographics and interests from engagement patterns. It also benchmarks your metrics against those of similar businesses to optimize performance and identify opportunities for improvement.
Within the platform, you can design campaigns, automate journeys, and track performance through built-in analytics.
Best for: Small businesses looking to start experimenting with AI-powered email optimization.
Pricing
- Free: $0/month
- Essential: $13/month
- Standard: $20/month
- Premium: $350/month
Mailchimp Case Study
World Central Kitchen (WCK) utilized Mailchimp's automated email campaigns and audience segmentation tools to coordinate disaster relief communications and drive donations during crisis response efforts. Moreover, WCK utilized Mailchimp’s email builder to create custom email templates, enabling the sending of brand-aligned emails in response to global crises in real-time.
According to Richard McLaws, Senior Content Manager at WCK, Mailchimp’s segmentation and marketing automation flows have also allowed WCK to experiment with attaining and retaining new subscribers. “It’s finding unique ways to engage every specific segment, because people want to get different things out of engaging with WCK,” Richard says. Mailchimp’s data-driven and intuitive email marketing workflows produced a 1.3x above industry open rate, enabling the organization to provide 186,000 meals from a single campaign.
6. SendPulse
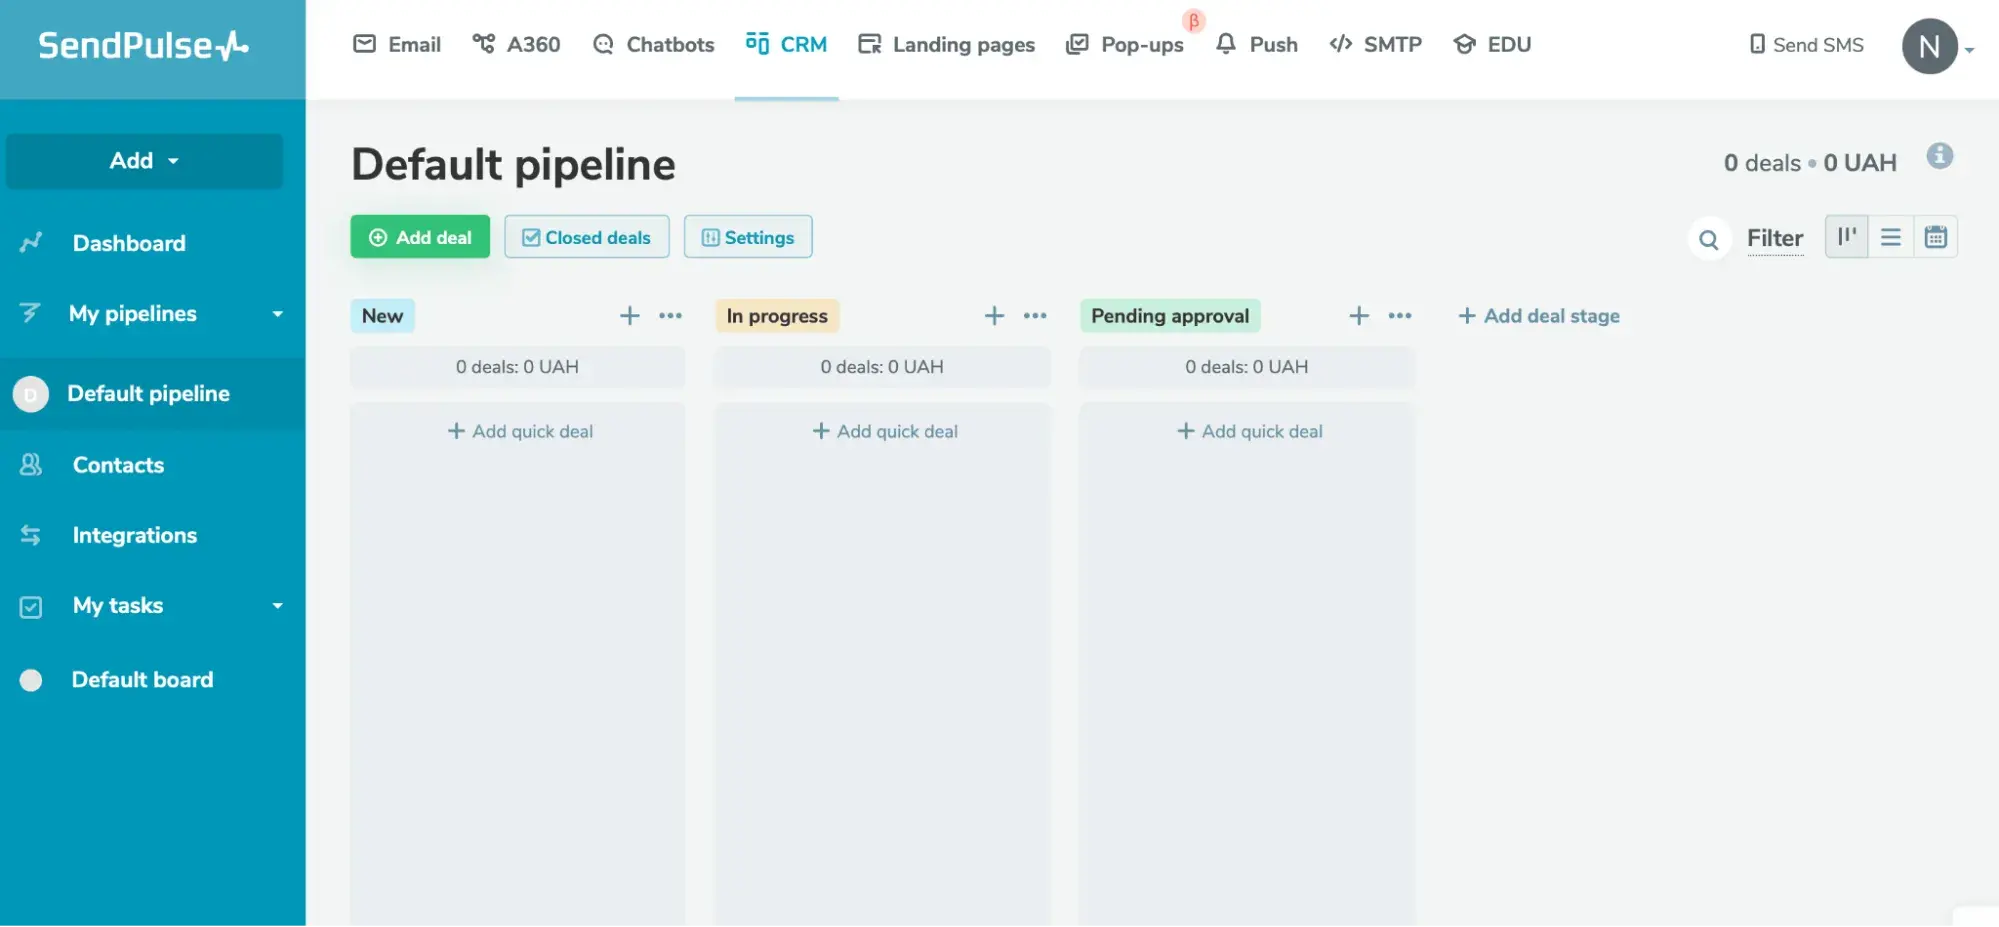
SendPulse combines email, chatbots, and SMS using AI to personalize messages across all touchpoints. Using machine learning for send time optimization and engagement prediction, it automatically adjusts delivery schedules and content based on individual subscriber behavior across channels.
Additionally, SendPulse’s AI technology creates unified customer profiles that predict the most effective channel and message for each interaction. Its AI also powers its personalization engine, dynamically inserting content based on predicted interests, and its engagement scoring helps identify your most valuable subscribers. Within the platform, you can create campaigns, build chatbots, and analyze cross-channel performance.
Best for: Budget-conscious teams needing multichannel AI capabilities.
Pricing
- Free Tier: $0/month
- Standard Tier: $8/month
- Pro Tier: $9.60/month
- Enterprise: Custom pricing only (see here)
Send Pulse Case Study
While Send Pulse does not feature formal client-facing success stories (and metrics) through their website, many users on G2, a software review platform, talked about the impact of its AI email marketing analytics and overall software functionalities. Yasen K., a small business owner and CEO, shared his experience via this G2 review page.
Yasen wrote, “Email, SMS, chatbots, and push notifications are just a few of the flawless automation channels that SendPulse offers as an all-in-one marketing platform.” He also added, “The automation tools, which enable customized workflows that improve engagement and conversions, are especially noteworthy.”
7. Twilio Segment
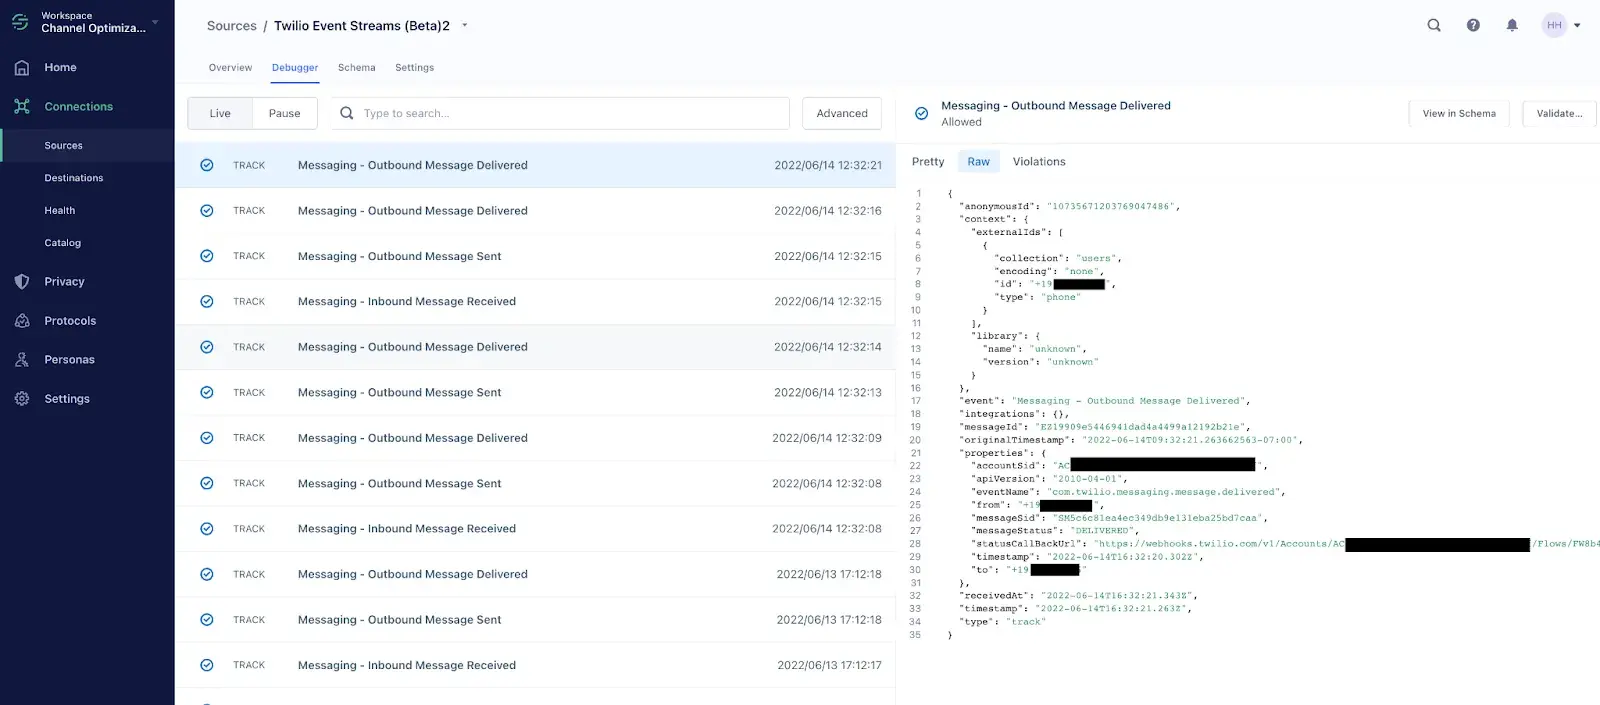
Twilio Segment enables AI-powered email marketing by creating golden customer profiles that feed into any marketing tool. Using identity resolution and predictive traits, it automatically merges data from multiple sources and calculates propensity scores that email platforms can leverage for advanced personalization. Additionally, Twilio Segment’s AI enriches profiles with computed traits, such as predicted lifetime value, churn probability, and product affinity scores, which update in real-time.
Within Twilio Segment, you can build data pipelines, create audiences, and sync predictions to 400+ marketing tools, including all major email platforms.
Best for: Data teams building custom AI analytics infrastructure for email marketing.
Pricing
- Free Tier: $0/month
- Team Tier: $120/month
- Business Tier: Custom pricing only (see here)
Segment Case Study
Camping World leveraged Twilio Segment’s customer data platform and predictive analytics to unify fragmented customer profiles across its digital channels. “The way we were tracking data was inconsistent,” noted Brad Greene, Senior Marketing Director at Camping World. “Even down to the same website, the data we collected and sent was slightly different between various tools like Google Analytics and Facebook Pixel. No one really trusted the data they were looking at.”
With Twilio Segment, Camping World’s paid media efforts saw a 35% increase in conversions. They also saw a 16% decrease in cost-per-lead due to cleaner and properly implemented data collection, thus allowing Camping World’s ads to perform better. Greene added, “With Twilio Segment, we have a full view of the customer, from the first time they hit our site to post-purchase and on.”
AI Email Marketing Metrics to Track
In this section, I’ll walk you through the most valuable AI email marketing metrics to track, including:
- Predicative engagement scoring
- Content intelligence analytics
- Send time optimization
- Deliverability and inbox placement
- Revenue attribution and lifecycle analytics
Each of these metrics transforms raw email data into actionable insights that directly impact revenue, starting with the most fundamental: understanding which subscribers are actually ready to engage with your content (aka predictive engagement scoring).
Predictive Engagement Scoring
Predictive engagement scoring is an AI-powered system that analyzes multiple data inputs to calculate the likelihood of individual subscribers taking specific actions in response to your emails.
Unlike traditional engagement metrics that report past behavior, predictive scoring utilizes machine learning algorithms to forecast future actions. It assigns numerical scores (typically 0-100) that indicate each contact’s likelihood of opening, clicking, or converting from upcoming campaigns.
Use the following data inputs to power your predictive engagement scoring:
- Historical engagement: This data forms the foundation, tracking opens, clicks, forwards, and replies across the last 90 to 365 days to identify patterns.
- Recency signals: This data includes the time since the last open (optimal: within 14 days), purchase recency, website visit recency (within 7 days indicates active interest), and email frequency tolerance based on engagement patterns.
- Profile data: This data incorporates demographic information, firmographic details for B2B, stated preferences, subscription types, and customer lifetime value.
- Behavioral signals: This data tracks website page views, content downloads, form submissions, cart abandonment patterns, and cross-channel interactions. The AI assigns weighted values to each behavior: product page views, pricing page visits, demo requests, and purchase completions.
Once you have predictive engagement scores, use them to optimize content distribution and timing automatically. These decision rules transform scores into actionable marketing strategies that improve performance while protecting the sender’s reputation.
Here’s how to prioritize each segment:
- High scorers (80-100): These subscribers generate 78% of email revenue despite being only 20% of the most subscribed lists. Send them premium content first, include it in all product launches, grant early access to sales, and approve it for high-frequency campaigns (3 to 5 emails per week).
- Medium scorers (50-79): This segment responds to value-driven content with clear benefits. They receive a standard campaign cadence (1 to 2 emails weekly), receive content 24 to 48 hours after high scorers, and are monitored weekly for score movement.
- Low scorers (20-49): Limit to 1 email weekly maximum, exclude from promotional campaigns unless highly relevant, and enter into re-engagement series before removal consideration. Only 12% reactivate, but those who do show 2x higher lifetime value.
- Critical scorers (below 20): Suppress from regular campaigns immediately, enter into the final 3-email win-back sequence over 45 days, then remove after 90 days of non-engagement. Continuing to email this segment reduces overall deliverability by 25%.
How to Calculate a Predictive Engagement Score
A predictive engagement score is like a credit score for your email subscribers — it predicts how likely each person is to open, click, or buy from your next email.
Behind the scenes, AI analyzes data points about each subscriber, transforms them into meaningful patterns, and outputs a simple 0-100 score that marketers can actually use. While the math happens automatically, understanding the basics helps you trust the predictions and recognize which subscriber behaviors are most important.
Here’s how you’ll set up your data infrastructure to ensure that AI calculates engagement scores correctly:
- Step 1: Gather your raw data inputs. Start by collecting four categories of subscriber information that feed into the scoring model. This information includes email interaction history (opens, clicks, forwards, replies, and unsubscribes from the past 90 to 365 days), website behavior (page views, time on site, content downloads, form fills, and shopping cart activity), profile information (industry, company size, job title, location, acquisition source, and subscription preferences), and purchase data (transaction history, average order value, product categories, and time between purchases).
- Step 2: Transform data into predictive features. Next, suggest meaningful patterns that the AI can learn from — such as turning “opened five emails in 10 days” into an “engagement velocity” score. To create this information database, include recency scores (convert “last opened 3 days ago” into a freshness score (0-100) where recent = higher), frequency patterns (calculate average emails opened per month and compare to subscriber segment baseline), monetary indicators (combine purchase history with browse behavior to create “purchase intent” signals), engagement ratios (divide clicks by opens to measure content interest beyond just opening emails), and behavioral clusters (group similar actions like “reads blog + downloads guide = education seeker”).
- Step 3: Apply machine learning to generate scores. AI models analyze thousands of historical examples where the outcome is known (i.e., whether the conversion occurred or not) to learn which feature combinations predict success. Be sure to include pattern recognition (when AI identifies that subscribers who open 3+ emails, visit a pricing page, and download content score 85+), weight assignment (more predictive features get higher importance), and score calculation (combine all weighted features into a final 0-100 score) in your scoring model.
- Step 4: Understand HubSpot’s simplified scoring system. HubSpot’s Breeze Intelligence for predictive scoring eliminates the complexity by handling all data processing behind the scenes. Instead of building models yourself, Breeze automatically collects data, engineers features, generates scores, and provides recommendations. (Within HubSpot, you’ll see scores presented as Hot (80-100), Warm (50-79), and Cold (0-49)).
- Step 5: Validate and apply your scores. Lastly, once Breeze Intelligence for predictive scoring generates your scores, validate their accuracy, create action triggers, and personalize your email content as needed.
Content Intelligence Analytics
Content performance scoring uses AI to evaluate and predict the effectiveness of email subject lines, body copy, and templates by analyzing multiple quality signals and comparing them against historical performance data. This scoring system assigns numerical values (typically 0-100) to email content based on semantic similarity to high-performing messages, readability metrics, brand voice consistency, and predicted engagement uplift.
To get a better understanding of each scoring factor, take a look at the list below:
- Subject line scoring: This scoring component measures emotional sentiment, urgency indicators, personalization elements, optimal length (6 to 10 words), power word usage, and emoji effectiveness.
- Body copy scoring: This scoring component evaluates readability (aiming for an 8th-grade level), paragraph structure, CTA prominence, value proposition clarity, and scanability through the use of subheadings and bullet points.
- Template scoring: This scoring component analyzes visual hierarchy, mobile responsiveness, text-to-image ratio (60:40 optimal), button placement above the fold, and white space distribution.
- Brand voice adherence: This scoring component measures consistency with established tone guidelines through natural language processing that analyzes vocabulary patterns, sentence structure, formality levels, and emotional tone.
- Historical uplift prediction: Calculates expected performance improvement by comparing new content against baseline metrics from similar past campaigns.
Measuring Content Relevance and Uplift
Content relevance and attribution uplift tell you exactly how much improvement each content change delivers. Without proper testing, you can’t know if better results came from your content changes or from external factors like seasonality, news events, or random chance.
Just think of these controlled experiments like testing a new recipe: you need to keep all ingredients the same, except for one, to know which change made it taste better.
To measure genuine improvement, you need clean comparisons that isolate the impact of your content changes. Use the following step-by-step system to run clean tests:
- Step one: Randomly divide your list into two equal groups using your platform’s A/B testing feature.
- Step two: Send both versions simultaneously to eliminate timing bias.
- Step three: Keep everything identical except the one element you’re testing.
- Step four: Run tests for at least 7 days to account for daily variations.
Content insights in Content Hub automatically track these test results and calculate statistical significance, showing you which content variations drive meaningful uplift without requiring manual analysis of the data.
Pro tip: Be sure to exclude new subscribers (less than 30 days) who could exhibit unpredictable behavior.
Send Time Optimization Accuracy
Send Time Optimization (STO) accuracy measures how effectively AI-predicted delivery times outperform standard scheduling by comparing engagement metrics between optimized and baseline send times. STO calibration is the process of fine-tuning these predictions to account for audience-specific patterns, ensuring the AI model’s recommendations align with actual subscriber behavior rather than generic best practices.
STO Test Design: A Simple Framework for Validation
To ensure STO accuracy, here’s what you’ll want to do (in three simple steps):
- Step one: Split your list into two equal groups (week 1 and 2). Divide your email list randomly using your platform’s A/B testing feature — this ensures fair comparison without bias. Group A (Control) receives emails at your current standard time, typically Tuesday at 10 AM or whatever schedule you’ve been using. Group B (Test) receives emails at AI-predicted optimal times unique to each subscriber.
- Step two: Run your test for at least four email campaigns to gather reliable data. Single email results can be misleading due to variations in content or external factors. Track three simple metrics that matter most: Open Rate Comparison, Click-to-Open Rate, and Conversion Tracking.
- Step three: After your initial test, make a clear decision based on results and set up monitoring for long-term success. Use Green, Yellow, and Red indicators to assess success. Green should signal the need to expand AI usage, Yellow should indicate continuing testing, and Red should represent negative results.
Pro tip: Document your results in a simple spreadsheet, including:
- Date
- Campaign Name
- Standard Time Performance
- AI-Optimized Performance
- Improvement Percentage
After 10 campaigns, you’ll clearly see whether STO works for your specific audience.
How to Validate STO Results
Before trusting AI to determine when your emails are sent, use this validation checklist to confirm the system improves performance without overwhelming subscribers.
This three-step process ensures statistically valid results while protecting your sender reputation:
- Step one: Set up proper testing parameters. Establish your sample size requirements with at least 1,000 subscribers per test group (control vs. optimized), ideally 5,000 per group for B2C brands. Configure your control group by randomly selecting 15-20% of your list to receive emails at your standard “best practice” time, while the test group gets AI-optimized timing. Run tests for a minimum of 4 campaigns or 14 days to gather statistically significant data.
- Step two: Account for external factors. Adjust for seasonality by recognizing that engagement patterns shift on a quarterly basis. Additionally, validate day-of-week performance by excluding Mondays from B2B tests and testing weekends separately for e-commerce audiences. Ensure test groups have balanced characteristics, including a similar timezone distribution, an equal mix of high/medium/low engaged users, and proportional representation of VIP customers.
- Step three: Implement safety guardrails. Create frequency protection rules that prevent any subscriber from receiving emails more than once per 24 hours, cap weekly sends at a maximum of four emails, and maintain a minimum 6-hour gap between any two sends. Set up quality control checkpoints to flag anomalies (like AI suggesting 2 AM sends or optimal times that vary by more than 4 hours week-to-week for the same subscriber). Then, configure emergency stop triggers that pause STO if deliverability scores drop below 80, unsubscribe rates increase 50% above normal, or customer support tickets mentioning email frequency double.
Deliverability and Inbox Placement Analytics
Deliverability analytics measure whether your emails reach subscribers’ inboxes versus spam folders or get blocked entirely. These metrics utilize AI to predict delivery issues before they impact your sender reputation, helping maintain a 95%+ inbox placement rate (IPR) required for successful email marketing.
Monitoring Sender Health Over Time
Tracking inbox placement trends involves monitoring where your emails land over time to identify delivery issues before they escalate.
By monitoring daily placement rates and comparing them to your baseline, you can identify issues 5 to 7 days before they significantly impact your email program, allowing you to adjust your strategy and protect your sender reputation.
To track inbox placement trends, complete the following steps:
- Step one: Create a simple spreadsheet or dashboard tracking five essential metrics each day. Include the following metrics in your daily monitoring system: Inbox Rate (percentage reaching primary inbox), Spam Rate (percentage in spam folder), Tabs/Promotions (Gmail’s promotions tab placement), Missing Rate (emails that disappear entirely), and ISP Breakdown (separate rates for Gmail, Outlook, Yahoo to identify specific problems).
- Step two: Create a weekly trend analysis. Calculate 7-day rolling averages to smooth out daily variations. (A healthy trend shows inbox placement staying within 3% of your baseline. If placement drops 5% week-over-week, that’s an early warning.)
- Step three: Complete weekly health checks. Every Monday, review your 7-day placement average. If it drops below 90%, implement “Engagement Week” — send only your best content to the most engaged subscribers. This prevents minor issues from becoming major problems.
- Step four: Configure deliverability tools in Marketing Hub to notify you when inbox placement drops below a performance threshold (for example, when spam complaints exceed 0.1% or bounce rates spike above 2%). These real-time alerts ensure that you catch problems within hours, rather than discovering them during weekly reviews, giving you time to implement corrective actions before deliverability issues escalate.
Once your emails consistently reach inboxes, the next challenge is proving their business impact. While deliverability ensures your messages arrive, you need sophisticated attribution models to connect those delivered emails to actual revenue and understand how they influence the entire customer lifecycle.
Revenue Attribution and Lifecycle Analytics
Email attribution connects every email interaction — opens, clicks, replies — to specific business outcomes by tracking how these actions influence deals throughout the sales cycle.
When someone opens your product announcement email, clicks the demo link, and eventually becomes a customer three weeks later, attribution mapping traces this journey by linking the email event to their contact record, then to their sales opportunity, and finally to the closed deal.
This unified Smart CRM attribution ensures that marketing receives credit for revenue influence, while sales teams see which campaigns warmed up their prospects. Understanding exactly how this attribution flows through your CRM requires breaking down each layer of the tracking process, from initial engagement to final revenue calculation.
In the following section, I'll walk you through how modern AI-powered platforms transform scattered email interactions into a clear revenue story.
The Three-Layer Attribution Process
Here’s a more detailed breakdown of how the email attribution and lifecycle work:
- First, email events attach to Contact Records, where every interaction builds a behavioral timeline. For example, Sarah opened five emails, clicked three pricing links, and downloaded a white paper, all of which were tracked with timestamps on her contact profile.
- Next, these engaged contacts convert to Opportunities when they take sales-ready actions. That whitepaper download triggers a lead score increase, creating a qualified opportunity worth $50,000 based on Sarah’s company size and engagement level.
- Finally, when opportunities are converted into Closed Deals, the system calculates attribution. Sarah’s $50,000 purchase is attributed 40% to the initial awareness email, 35% to the nurture campaign that kept her engaged, and 25% to the final promotional email that drove her to submit a demo request.
Modern platforms (like HubSpot) automatically map this entire journey. Then, AI technology (such as Breeze AI) analyzes patterns across thousands of these journeys to identify which email sequences, subject lines, and content types most effectively move contacts through each stage. This visibility transforms email from a “spray and pray” channel into a predictable revenue driver where you can forecast that every 1,000 emails to engaged contacts generates approximately $25,000 in influenced revenue within 90 days.
How to Build AI Email Analytics Dashboards Your Team Will Actually Use
The most effective AI email analytics dashboards follow a three-tier structure that progresses from high-level business metrics to predictive insights to operational health indicators. Ultimately, your dashboard should tell a story at a glance:
- Are we hitting revenue goals? (tier 1)
- What’s likely to happen next month? (tier 2)
- Are there any issues requiring immediate attention? (tier 3)
HubSpot Marketing Hub’s customizable dashboards enable this exact layout, with drag-and-drop widgets that automatically update as your AI models process new data, ensuring teams always see the most current insights without manual reporting work.
What Your AI Email Analytics Dashboard Should Look Like (from Top to Bottom)
A well-designed AI email analytics dashboard follows a strategic visual hierarchy that guides your team from high-level business outcomes down to operational alerts, ensuring critical information gets noticed first. The following structure mirrors how marketing leaders actually consume data:
- Top section: Top KPIs and performance metrics. Start with five essential metrics that directly tie to business goals. These metrics include: email-attributed revenue, predictive lifetime value, engagement velocity, and active subscriber growth. These KPIs should display as large numbers with sparkline trends, making performance immediately clear even from across the room.
- Middle section: Predictive insights and AI forecasts. Your dashboard’s predictive layer transforms historical patterns into actionable insights for the future. Next month’s revenue forecast uses engagement trends, seasonal patterns, promotion schedules, and conversion probability scores to predict income. Additionally, content performance predictions evaluate subject line components, body copy structure, CTA placement, and send timing to score upcoming campaigns before they are deployed. Lastly, campaign opportunity scores combine audience segment value, content readiness, competitive timing, and historical performance to recommend which campaigns to prioritize for maximum ROI. (HubSpot Marketing Hub’s Breeze Intelligence powers these predictions, learning from your specific audience behavior rather than generic benchmarks.)
- Bottom section: Health indicators and proactive alerts. The bottom dashboard layer monitors technical and operational health with clear visual indicators — green, yellow, or red status badges that demand attention when needed. Include areas for deliverability health scores, engagement decay triggers, and anomaly detection. Set these alerts to send Slack or email notifications when thresholds breach, ensuring teams respond within hours rather than discovering issues during weekly reviews.
TDLR — Your dashboard should refresh hourly for alerts, daily for KPIs, and weekly for predictive insights, balancing real-time awareness with meaningful trend analysis.
Frequently Asked Questions (FAQ) about AI Email Analytics
Which AI email metrics matter most for modern marketing teams?
Modern marketing teams should prioritize five AI email metrics that directly impact revenue:
- Predictive engagement scoring (identifying subscribers likely to convert)
- Content intelligence analytics (measuring which subject lines and content drive action)
- Send time optimization accuracy (validating when AI-recommended send times outperform manual scheduling)
- Deliverability metrics (tracking inbox placement rates using AI pattern detection)
- Revenue attribution analytics (connecting email touchpoints to closed deals)
HubSpot Marketing Hub provides native dashboards for tracking these AI email analytics metrics in real-time, while Breeze AI enables predictive scoring that identifies high-value subscribers before they convert.
How do I validate AI predictions in email analytics?
Validate AI predictions by running control tests that compare AI-recommended actions against your baseline performance. Track prediction accuracy rates by measuring whether subscribers identified as “highly engaged” by AI actually open, click, and convert at predicted rates. That said, I recommend aiming for an accuracy rate of 75% or higher.
HubSpot Marketing Hub enables A/B testing between AI-optimized campaigns and traditional segments, automatically calculating statistical significance. Document performance over 30 to 60-day periods to identify seasonal variations and model drift. AI email marketing analytics tools should provide confidence scores for each prediction to ensure accuracy.
How do I measure an email’s revenue impact with AI?
AI-powered revenue attribution connects email touchpoints to closed deals through multi-touch attribution models that track the complete customer journey. Configure your AI email analytics to track first-touch, last-touch, and weighted attribution across all email interactions, assigning revenue credit based on engagement patterns and proximity to conversion.
HubSpot Marketing Hub’s revenue attribution reporting automatically calculates email ROI by connecting campaign engagement to CRM deal data. At the same time, HubSpot’s Breeze Intelligence identifies which email sequences drive the highest customer lifetime value. Track metrics like:
- Revenue per email sent
- Customer acquisition cost by email campaign
- Lifetime value by email segment
Get a demo of Breeze to see how predictive analytics can forecast the impact of email revenue before the campaigns launch.
How should I benchmark AI email metrics?
Benchmark AI email metrics against three standards:
- Your historical baseline (pre-AI performance)
- Industry averages for your sector
- The AI model’s predicted outcomes
Then, track improvement rates monthly. Compare your predictive engagement accuracy (should exceed 70%), send time optimization lift (target 15-25% improvement), and revenue attribution coverage (aim for 80%+ of conversions tracked).
Marketing Hub provides industry benchmark data within its reporting dashboards, comparing your AI metric performance against similar-sized companies in your sector. Document performance gaps and set quarterly improvement targets for each AI metric.
What’s the best way to present AI analytics to leadership?
Present AI email analytics to leadership by focusing on revenue impact, efficiency gains, and predictive insights rather than technical metrics.
Create executive dashboards showing three key storylines:
- Revenue attributed to AI-optimized emails
- Time saved through automation
- Predicted future performance based on current trends
HubSpot Marketing Hub enables custom executive dashboards that visualize AI email marketing analytics alongside business KPIs, while Breeze provides predictive forecasts for upcoming quarter performance.
Structure presentations with before-and-after comparisons, showcasing specific examples of AI predictions that prevent churn or identify hidden opportunities. Additionally, confidence intervals and risk assessments should be included to build trust in AI recommendations.
See this dashboard in HubSpot for executive-ready AI analytics templates that translate complex metrics into business outcomes.
Transform your email marketing with AI-powered analytics.
AI email marketing analytics has evolved from a nice-to-have into a critical driver of marketing success. The five metrics we’ve explored — predictive engagement scoring, content intelligence analytics, send time optimization, deliverability monitoring, and revenue attribution — work together to create a complete picture of your email program’s health and potential.
As you implement these metrics, remember that implementing AI email analytics isn’t just a work in progress; it’s a process. Start with one or two metrics that address your biggest challenges — whether that’s improving engagement, fixing deliverability issues, or proving revenue impact. Build confidence in the predictions, establish baseline performance, and gradually expand to the full suite of AI-powered insights.
Ready to harness the potential of AI for your email marketing campaign? Get started with HubSpot’s Marketing Hub or Reporting and Dashboard Software today.