I primarily work with B2B clients, so I’m getting very well-versed in B2B marketing analytics. Every month, I report on the marketing for the prior month, and I turn those marketing analytics into stories and actions. Believe it or not, B2B marketing analytics doesn’t have to be boring.
I use various tools for my analytics, including but not limited to Google Analytics, Google Search Console, Looker Studio for automated dashboards (which makes light work of reporting on marketing analytics), Semrush, and so many more.
![Download Now: Free Marketing Plan Template [Get Your Copy]](https://localseoresources.com/wp-content/uploads/2025/03/aacfe6c7-71e6-4f49-979f-76099062afa0-1.png)
In this article, I’m digging into B2B marketing analytics, including what it is, the essential data to collect, and how to set up B2B marketing analytics — and I’ve shared tools, too.
As I said, there’s no one way to report on B2B analytics, so I spoke to B2B marketers who manage analytics for B2B companies daily. I got their insights on their favorite tools and what they love about them.
Table of Contents
What is B2B marketing analytics?
B2B marketing analytics is data that helps you understand your product, service, and/or audience. Marketers use marketing analytics to understand if marketing promotes a product or service successfully and increases sales.
Through data, marketers can create stories that lead to actions on how marketing can refine campaigns to get closer to company and marketing goals.
B2B marketing analytics includes:
- Collecting data.
- Measuring and analyzing data.
- Using data to make data-driven business decisions.
Collecting data and knowing what to measure is no easy feat. Marketers talk about analysis paralysis, which describes the feeling of overwhelm when you have so much data at your disposal that you struggle to make decisions.
The clue is in the name, but marketing analytics is not the same as business analytics. However, business goals and performance should be considered when measuring marketing.
B2B Marketing Data to Collect
The best and worst thing about digital marketing analytics is that you can track everything, which can be overwhelming.
The key is to track what you need. The metrics you need should be things that help you understand your customers and your business so you can make data-driven decisions that improve your business.
To find out what metrics B2B marketers are tracking, I reached out to marketing managers who shared the B2B marketing analytics they track and why.
Revenue and MRR
Revenue and monthly recurring revenue (MRR) are obvious metrics to follow. Revenue, in particular, is the one metric that is crucial to all businesses.
For Ivan Burban, head of marketing at Coupler, revenue data is the most important. Burban describes MRR growth as the “north star metric.”
When I asked him why tracking revenue and MRR is important, Burban said, “Understanding data from all marketing channels [gives] insights into how your activities impact MRR traction.”
Burban notes that teams can see how marketing channels performed during the period and how successful acquisition/retention efforts were. “This also allows you to push well-performing activities, experiment, and cease non-performing efforts,” he says.
For example, he told me they invested in PPC for a few months and analyzed its performance. When it became clear that it didn’t boost their MRR growth even though they were spending substantial resources, they paused advertising and focused on developing a partner program.
I love what Burban is saying here, particularly the importance of understanding data from different marketing channels. Most B2B marketing analytics tools allow you to view and compare revenue from channels. With this functionality, you can see what’s working and what needs improving.
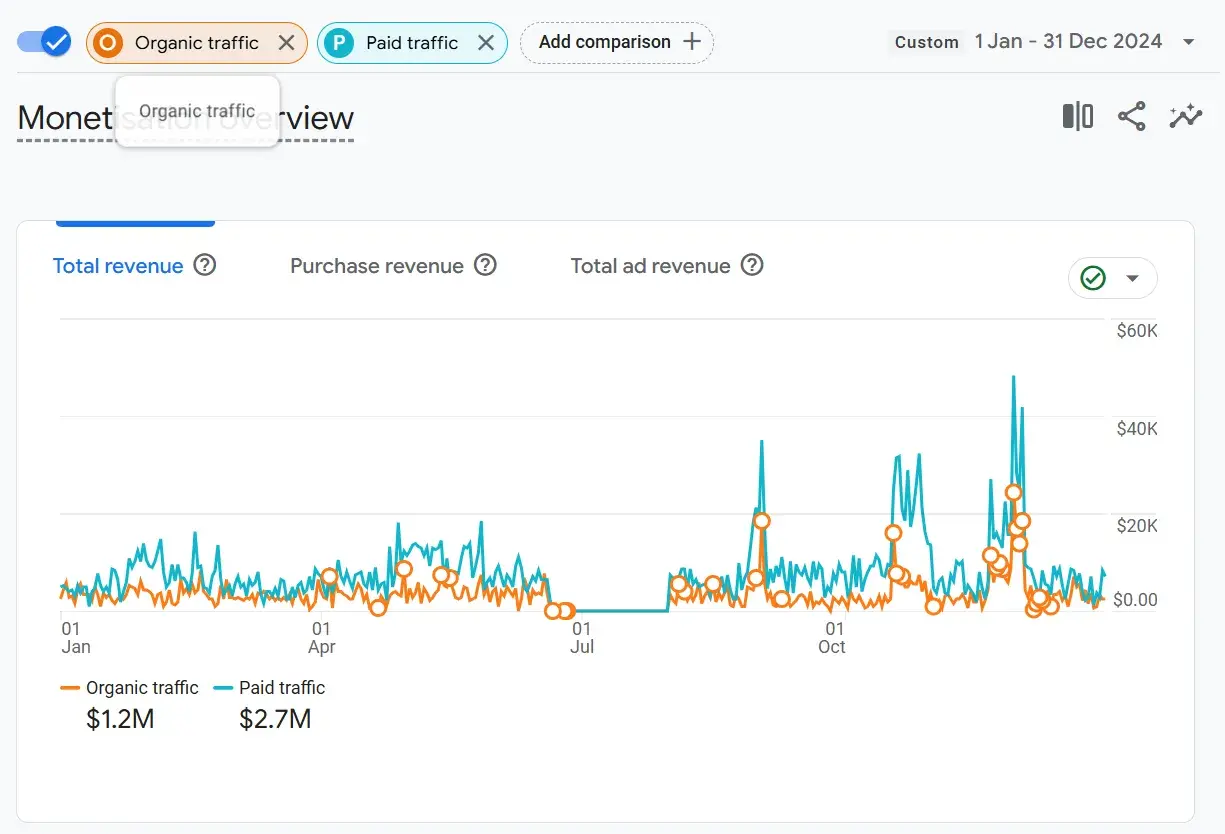
Pro tip: For larger marketing teams with online and offline marketing efforts, I’d like to note the importance of media mix modeling here. While revenue data in the screenshot above is incredibly useful, it doesn’t always tell the whole picture. I wrote an entire article on media mix modeling, which details the relationship between marketing and sales, even if it’s not directly obvious in reports. It’s definitely worth a read.
Considering the above (that the revenue graphs don’t always show the full picture), I wanted to know how Ivan Burban makes sense of data.
He says, “To decide on action points, you also need to evaluate customer data (CLV and retention rates) and data per marketing channel (for instance, the conversion rate for your landing pages and blog).”
In any case, Burban notes that revenue-related data is the most useful since it helps to prioritize marketing activities and understand the overall marketing state.
Burban agrees that revenue in isolation is not enough; you need to measure more to understand the full picture.
Engagement Metrics
Although revenue is the one metric that spans all businesses, engagement metrics were the most spoken about metric.
Of all the B2B marketers I spoke to, over half of them mentioned engagement metrics. For this reason, engagement metrics are listed here as the second metric.
Dominick Tomanelli is a marketing expert, co-founder, and CEO of Promobile Marketing. He knows a thing or two about B2B marketing analytics.
Tomanelli leaned into engagement metrics as data B2B marketers must track. For Tomanelli, engagement metrics are “the most valuable data.” He particularly likes to analyze how target audiences interact with campaigns.
He explains, “For example, it’s not just about how many people see a campaign but how many take the next step — signing up for a service, requesting more information, or even spending extra time engaging with the content.”
In B2B, these micro-actions are key indicators of intent. “If a decision-maker clicks on a demo request or spends significant time exploring a product page, that tells us we’ve hit the mark. It’s about quality over quantity. I’d rather have ten engaged leads than a hundred passive impressions,” Tomanelli says.
As a B2B marketer myself, I agree with Tomanelli. Engagement metrics are particularly important in B2B because sales cycles can be long. Marketing might get a conversion, but by the time the prospect has vetted options, involved stakeholders, engaged in demos to aid decision-making, etc., it can be months before a deal closes.
As a result, there’s no immediate revenue data, but if engagement is there, then marketing has some form of immediate feedback.
If, like me, you’re a consultant in the B2B space, you might have clients who aren’t great at “tying the loop,” i.e., telling you exactly how sales are doing from your leads. When this happens, you must rely on engagement metrics, such as form fills, whitepaper downloads, etc.
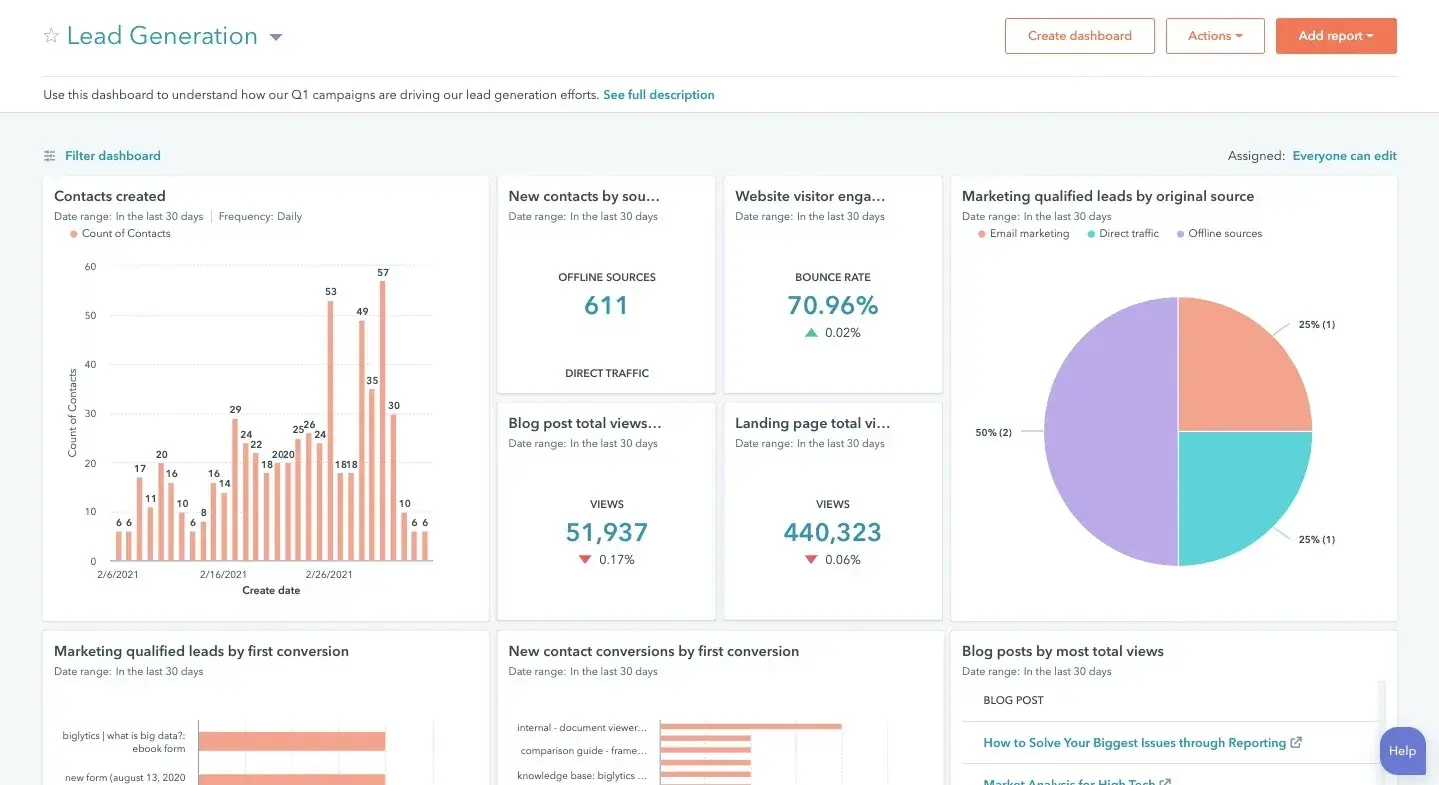
In my B2B marketing analytics meetings, I report on engagement metrics and conversions that I believe lead to sales. Below is a screenshot from my client’s monthly report. It shows:
- Form fills.
- Clicks to make a call.
- Clicks to email.
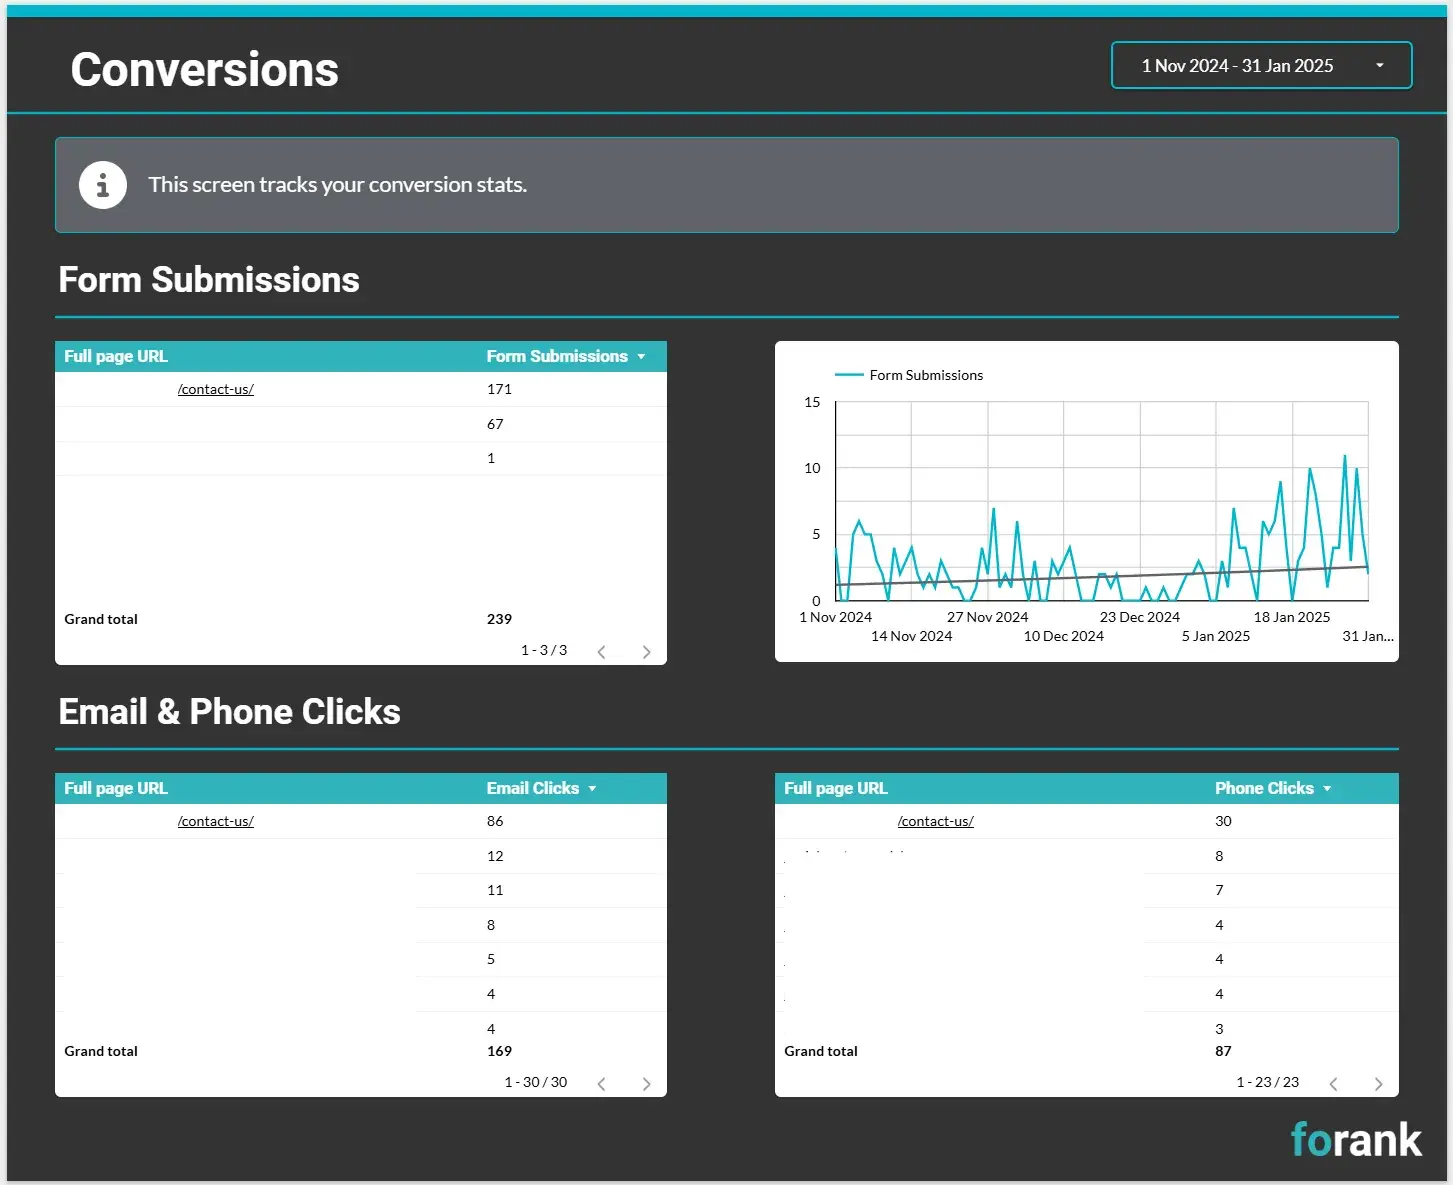
The great thing about this is that it’s automated using Looker Studio. I’ll tell you more about that later.
I put the report above in front of clients and ask them to tell me what’s been happening in sales. How are sales reporting on lead quality, for example. It’s critical to understand the data at a human level, otherwise it’s just numbers.
Tomanelli agrees, that the most important part of marketing analytics is always remembering the human side of the data. Numbers are great but only meaningful when you connect them to real people and their behaviors.
“Whether it’s a busy executive deciding whether to engage with a campaign or a nonprofit evaluating how well we met their goals, the data is just a way to better understand and serve those people,” Tomanelli says.
Pro tip: HubSpot’s Marketing Analytics is a great tool for measuring website engagement. The great thing about HubSpot is that you can do this alongside a lot of other analytics within the same tool, which spares the need to invest in and use several tools. HubSpot is seamless.
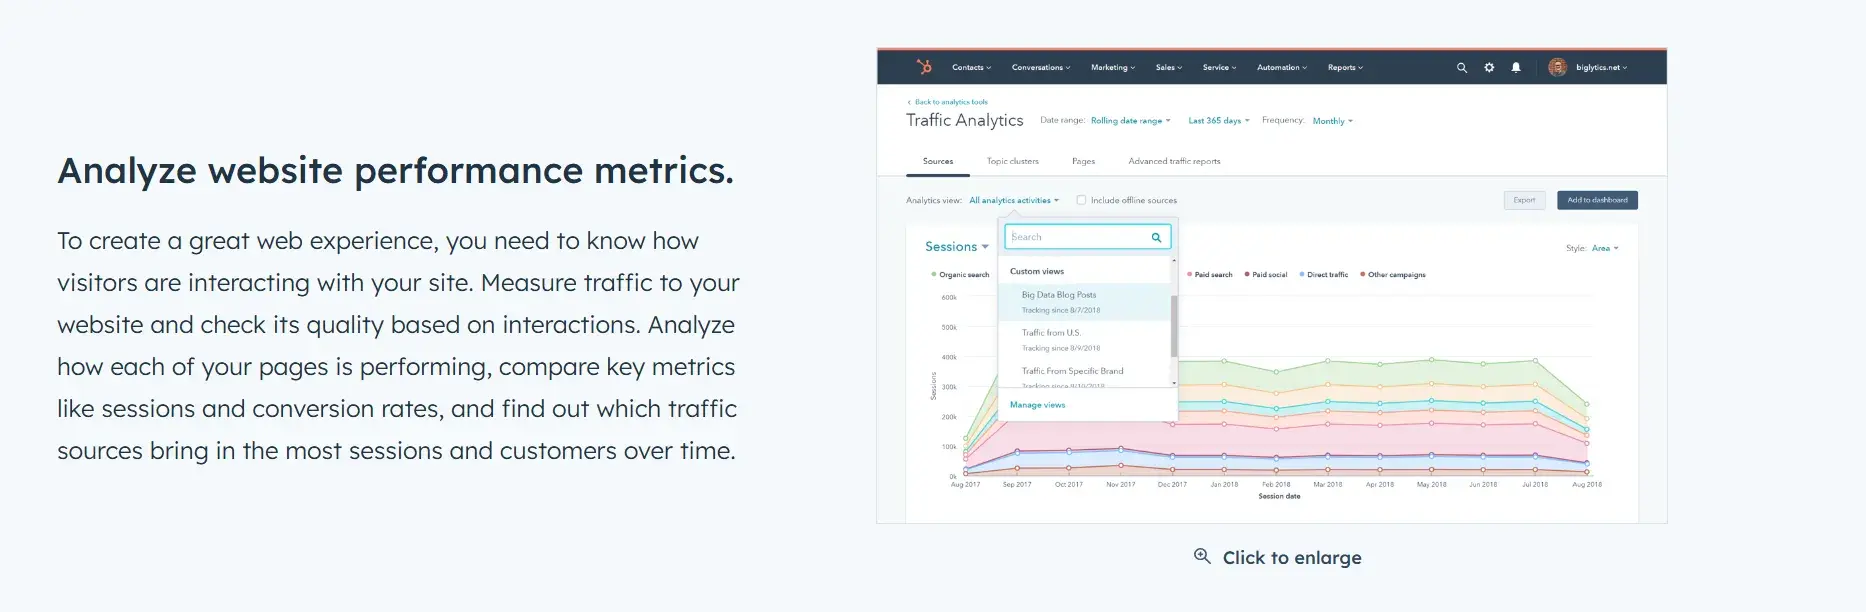
Check out HubSpot’s Marketing Analytics tool now.
The Sales Cycle
Since I mentioned the sales cycle earlier, I wanted to dig deeper into that. In B2B marketing, the sales cycle is particularly impactful on analytics.
Arthur Favier, founder and CEO of Oppizi, is here to tell us more. “Knowing the sales cycle — especially how long it takes to move leads through the funnel — is one of the most important pieces of information because it lets us know that our strategies perform well for our clients.”
Knowing the typical duration from initial contact to finished sale is very important in B2B settings because decision-making frequently involves several stakeholders, Favier notes.
“It assists you in determining whether a bottleneck is slowing down the process or if your strategies are shortening the cycle. For instance, if your data indicates that the sales cycle is taking 120 days when the industry average is 90 days, it is a strong indication that further investigation is necessary,” Favier says.
I loved this point from Favier. You can use benchmarking to determine if your marketing is helping or hindering your sales cycle.
I wanted to know what this data has taught Favier.
He says, “What I’ve learned is that not all leads or channels perform the same, and analytics are key to uncovering why. For example, tracking lead velocity across stages can reveal which parts of your funnel need attention — are leads dropping off after the demo stage? Are specific industries moving faster through the cycle?”
According to Favier, this level of detail allows you to focus resources where they’ll have the biggest impact, like adjusting messaging for slower-moving segments or prioritizing follow-ups for high-value leads. “Instead of guessing, you can make precise decisions that directly improve revenue and efficiency,” Favier says.
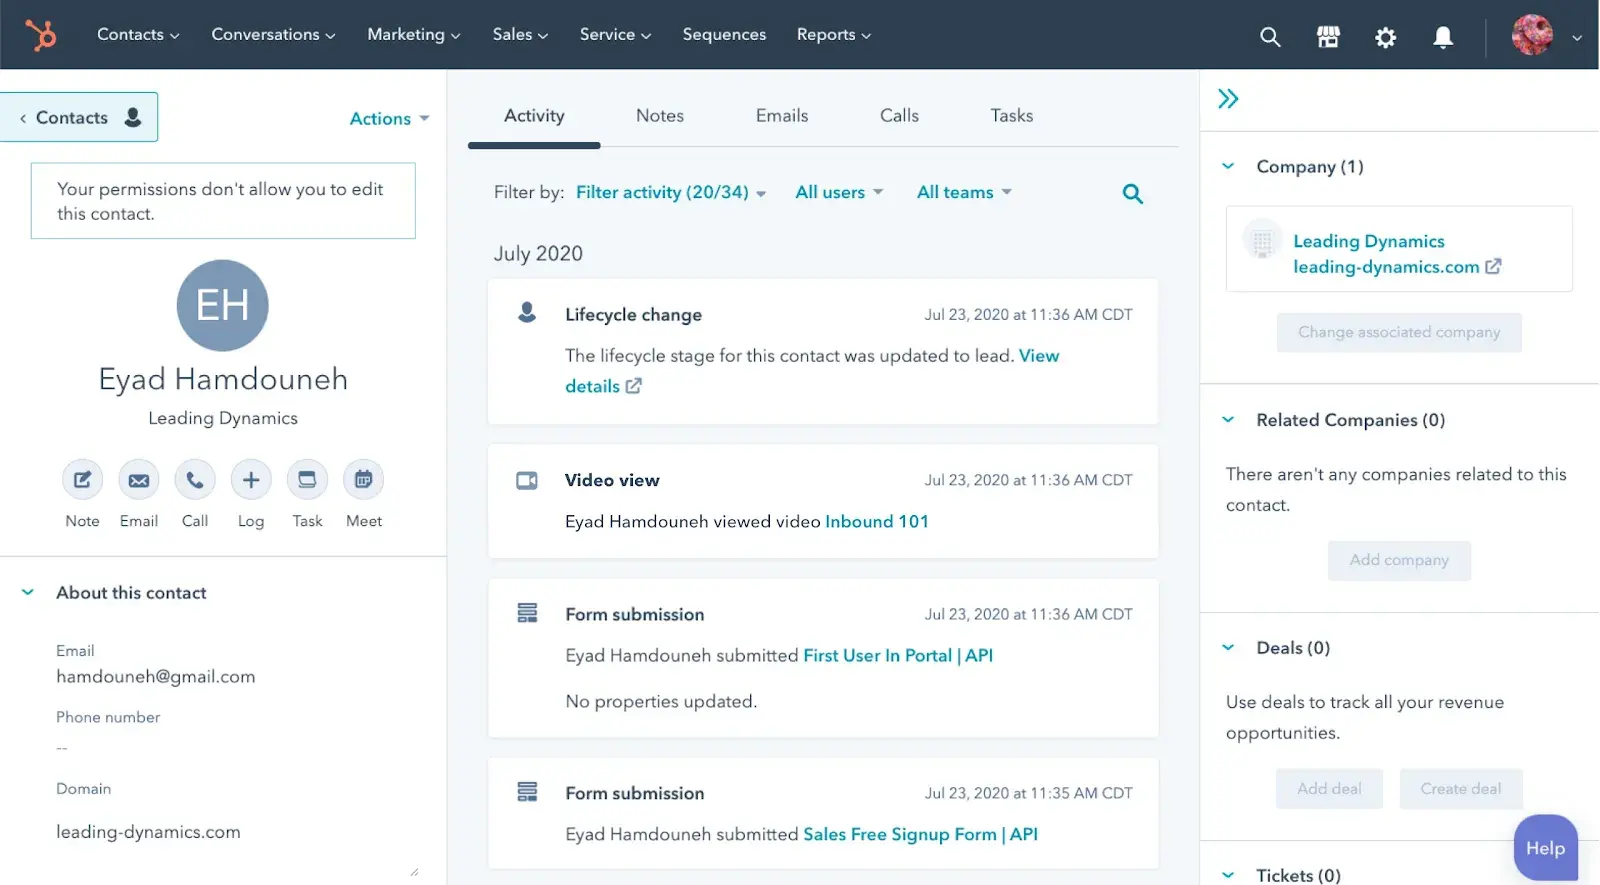
When it comes to your user’s journey through the funnel, CRMs like HubSpot keep track of this information. In a contact’s history you can see exactly what a contact has done throughout their entire history with your company. This data can be used to make data-driven decisions on what to do next.
Customer Acquisition
I spoke to Zayed Ahmed from ASL BPO about customer acquisition. Though, like any good B2B marketer, Ahmed started talking to me with a caveat — one mentioned earlier in this article, but important enough to repeat here. Ahmed said, “The most important thing is understanding the data that matters for your business goals.”
I wanted to repeat this because I know too well how easy it can be to read an article like this and get blindsided by all the tracking possibilities. Stick to what’s important for your business.
Ahmed claims that customer acquisition is B2B marketing data that’s important to him because “it shows me how people find us and why they choose us over others. This data tells you which marketing channels are bringing in leads, how people interact with your website, and what steps they take before they contact you.”
When I asked Ahmed for an example, he said, “I’ve seen patterns where most of our qualified leads come through organic search or LinkedIn. That tells me where to invest more of my time and resources. I’ve also learned that when leads drop off, it’s usually because something about the messaging isn’t connecting with them or the process is too complicated.”
Tying in nicely with an earlier point, Ahmed says, “I don’t try to track everything. That’s overwhelming and pointless. I focus on data that answers specific questions: Where are my leads coming from? Why are people dropping off? What do clients care about the most?”
Ahmed notes that when he gets these answers, he can make practical changes that help the business grow.
“It’s not about the numbers themselves. It’s about using them to solve real problems or find opportunities,” Ahmed says.
I’m noticing a theme of being able to create stories and humanize data in B2B marketing analytics.
Pro tip: You can make light work out of customer acquisition metrics using HubSpot’s resources.
A second B2B marketer, Christian Hed, CMO of Dstny, also values the role of customer acquisition. Hed notes that his marketing team mostly collects data that helps measure the success of the campaigns we’re running.
“For example, if that’s SEO, we’ll collect data on the volume and growth of sessions, clicks, click-through rates, and organic-generated conversions. If it’s paid, we closely measure the particular creatives and how well they perform,” Hed says.
Hed recommends tracking results carefully because we often prove our guts wrong.
“Without tracking data, you don’t continuously iterate and improve — or even know if something was a success. We once made an entire campaign we were so sure would work … and it flopped so badly. We were happy to know that that was the wrong direction to go in, even if it hurt our creative soul a little,” Hed says.
What I like: I really liked what Hed said about proving your gut wrong. I work closely with my co-founder, Leigh Buttrey, who has amazing marketing instincts. She wanted to run an email campaign with a brand-new, minimalist email style. I was adamant it wouldn’t work. She was confident it would.
Buttrey ran the test, and the data spoke for itself: The email received higher engagement, and everything I thought I knew about email was challenged.
I learned that day never to trust my gut because mine was so wrong! Get data. If the data supports your feelings, great; if it doesn’t, what an opportunity to learn.
Use Multi-Touch Attribution Models
When it comes to multi-touch attribution models, those who work in an agency have a lot of experience. Agencies juggle many campaigns across many channels for many businesses. Plus, they need their reporting to be time-efficient, accurate, and useful.
For insights on multi-touch attribution models, I spoke to Aaron Whittaker, VP of demand generation and marketing at Thrive Internet Marketing Agency.
Whittaker fits the bill of a multi-talented B2B marketer. He works on content, SEO, PR, and media relations and uses multi-touch attribution models to analyze marketing success.
He says, “Instead of focusing solely on last-touch metrics, we developed a multi-touch attribution system that tracks prospect interactions across months-long buying journeys. For example, we discovered that technical white papers, while rarely the final conversion point, played a significant role in enterprise deals by building credibility early in the decision process.”
Pro tip: You won’t have an easy time if you track multi-touch attribution manually, so do look for marketing analytics tools that can make this easy for you. HubSpot makes light work of tracking B2B analytics.
Whittaker credited an integration between HubSpot and GA4 for revealing unexpected insights about content engagement.
He says, “We found that prospects who engaged with product comparison content earlier in their journey had shorter sales cycles and higher conversion rates. This discovery led us to restructure our content strategy to introduce comparison tools sooner.”
Most valuable has been tracking micro-conversions throughout the buyer journey, according to Whittaker. Rather than just measuring form fills or demos booked, the team monitored actions like repeat visits to pricing pages or multiple team members from the same company viewing specific content. These behavioral patterns helped them identify high-intent accounts before they reach out.
“Looking at platform effectiveness, we leverage Tableau for custom reporting that connects marketing activities to actual revenue. This helps us understand which content types and channels drive the highest-value opportunities, not just the most leads,” Whittaker says.
I loved this insight about integrations from Whittaker, particularly because I know my co-founder, Leigh Buttrey, also finds this powerful. Buttrey is a PPC specialist and an incredible B2B marketing data analyst. Her reports are beyond insightful. She knows how to get the best data most efficiently. I’d be lost without her!
Buttrey says, “I like to use CRM integrations as part of my monthly reporting. With this, I’m able to identify leads right through to close.”
You’ll remember that I mentioned earlier how consultants can struggle to see what happens to leads acquired by marketing if clients aren’t transparent or particularly good at tracking it. Buttrey’s solution puts the power into marketing’s hands.
I wanted to know if there are any tools or tips for CRM integration.
Buttrey says, “Ensure that the CRM is properly set up with UTM tracking and automation workflows. HubSpot, and even some smaller CRMs, have powerful reporting tools, but they’re only as good as the data you feed them/
Buttrey says to always make sure clients have clear lead source attribution. This helps track campaign effectiveness through to revenue.
Buttrey warns, “It’s easy for a CRM to become messy over time. I schedule monthly checks to clean up data, ensure tracking is still accurate, and refine reporting to ensure we focus on the most valuable metrics.”
How to Set Up B2B Marketing Analytics
There are a multitude of ways in which you can set up B2B marketing analytics. For a moment, even I was overwhelmed by which reports I could teach you to set up. I knew I wanted to focus on GA4, though. I chose GA4 because I believe we should all use it (even better if you integrate it with your CRM).
Luckily, I know Kyle Rushton McGregor, who has extensive experience tracking B2B marketing analytics across a range of businesses and industries. He knew exactly which reports every B2B business should set up.
Rushton McGregor is a GA4 pro and the CEO of KRM Digital Marketing Ltd. He dedicates his entire working life to helping people get better at tracking, training people on GA4, and implementing GA4 reporting for clients.
As Google Analytics came to the end of life, Rushton McGregor did what many failed to do: He learned the ins and outs of GA4. As a result, Rushton McGregor knows a lot. He helped me scope this section, advising you to set up these main reports in GA4:
- Event tracking.
- Key events.
- Exploration reports.
The beauty of setting up these B2B marketing analytics is that you can customize them exactly to your business and marketing goals. I’ve already mentioned the importance of that.
My familiarity with Rushton McGregor’s work meant I had a couple of fun analytical setups I wanted to include, and that’s
- Tracking visits from AI (there’s nothing like being prepared for the future!).
- Customizing reports because it’s fun and helps a report feel like yours.
This guide assumes that you already know how to set up GA4 and that you have admin access. If you don’t have GA4 set up, there’s a thorough tutorial video here:
Okay, let’s get into it, starting with event tracking.
Step 1: Start creating the event.
You need admin access to create events in GA4. You need to go to the Admin Console, Data display, and click Events in the menu.
Then, click Create event.
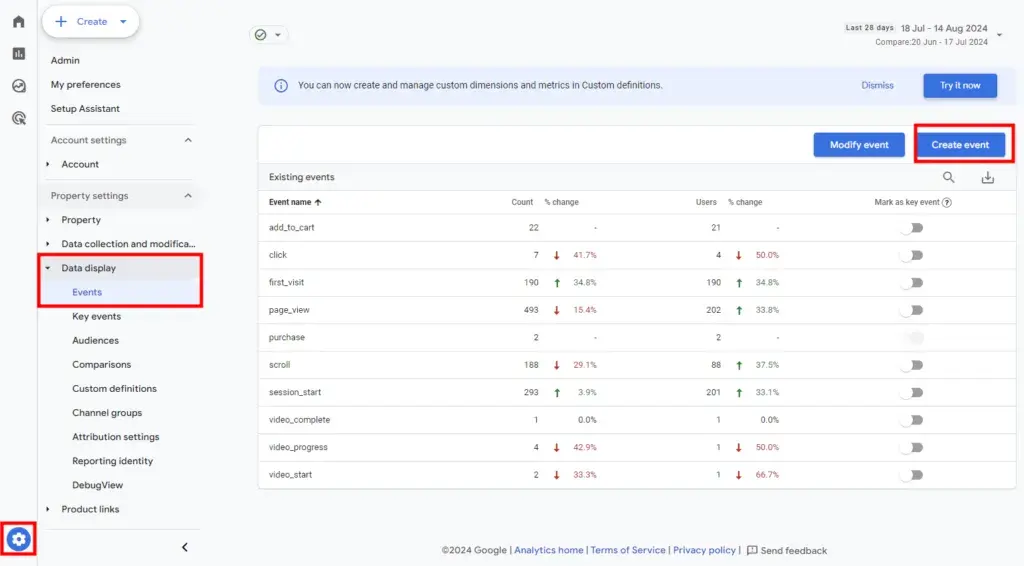
I walked through this in real time so I could provide the latest screenshots. Once you create an event, you might need to select your data stream if you have many. Once done, you can create or edit existing events.
We’re creating an event, so I clicked Create to configure the event details.
Step 2: Configure the event.
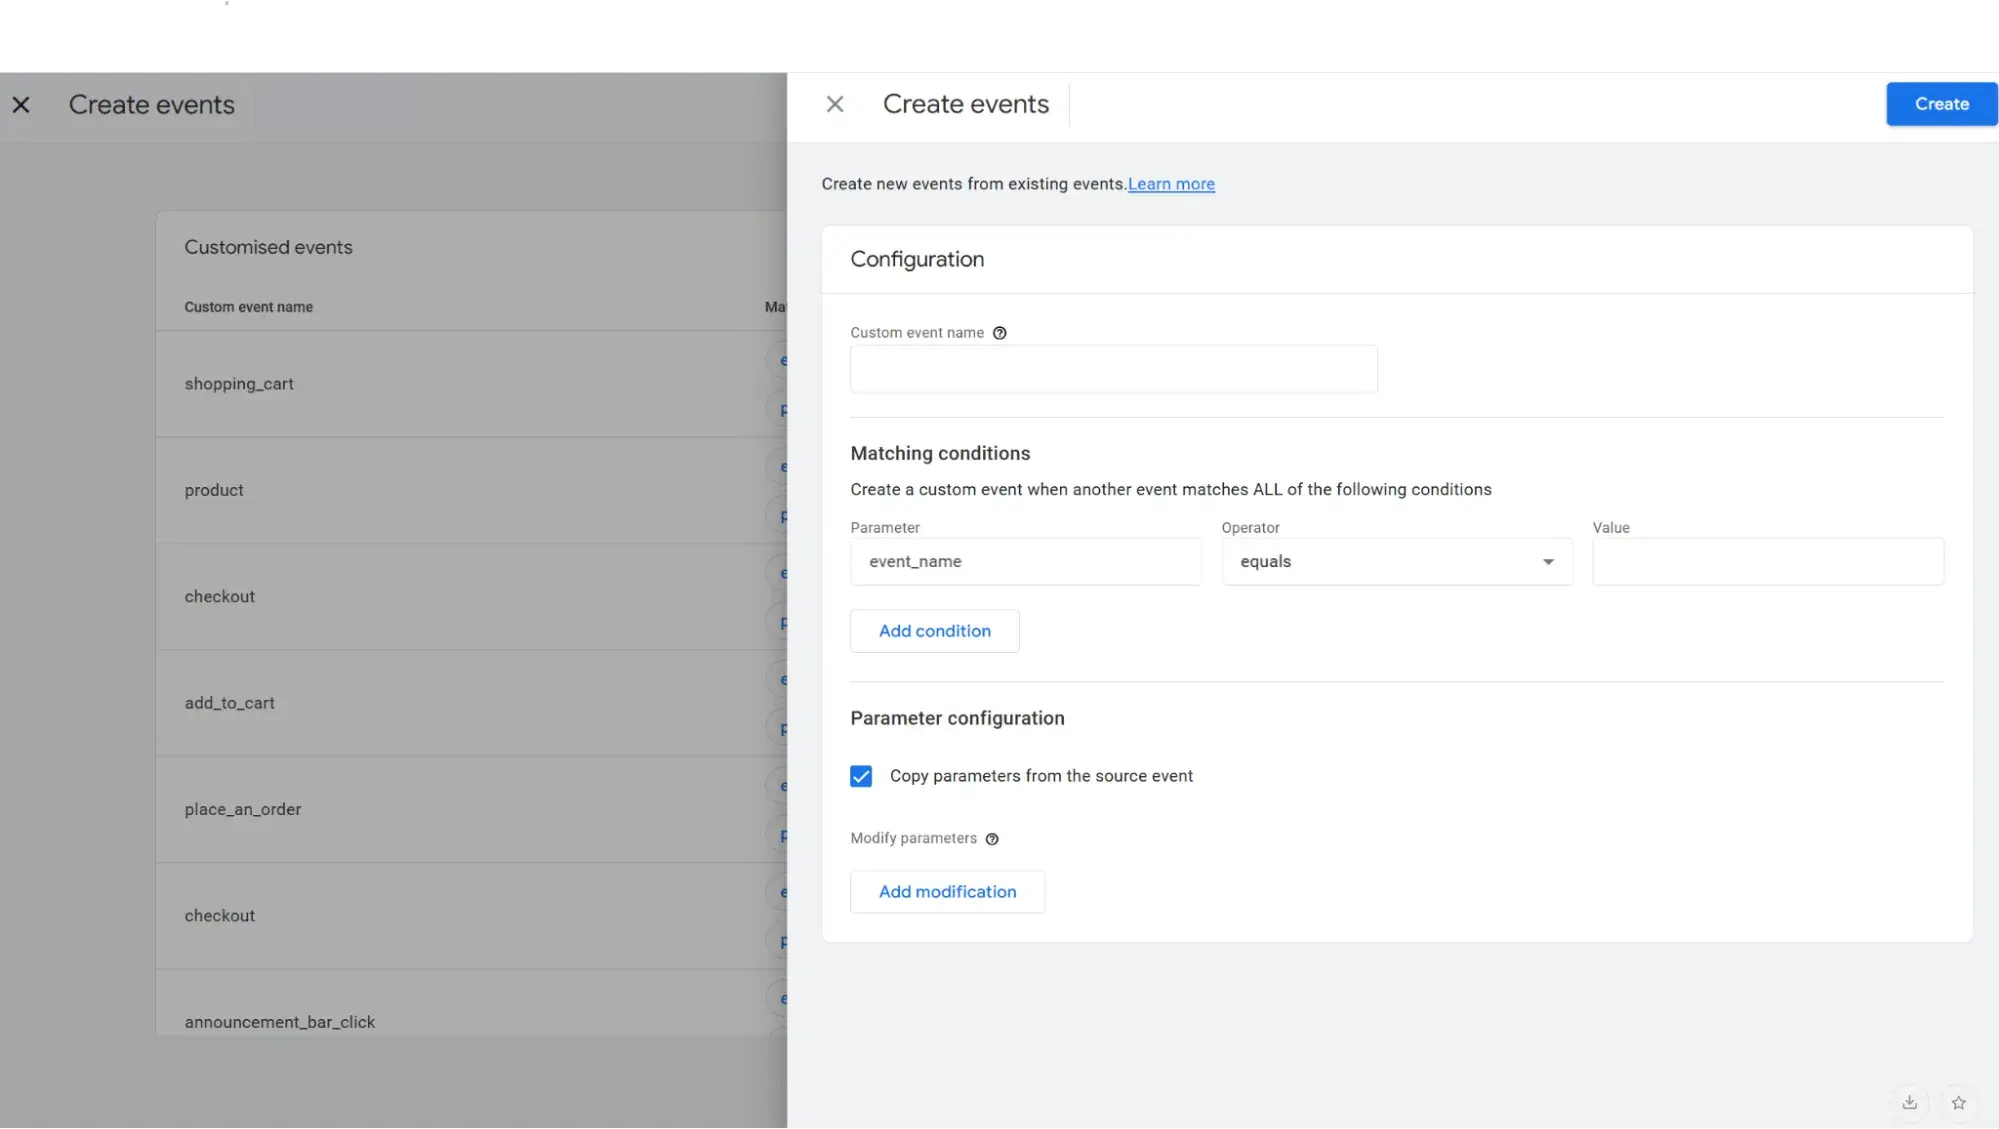
When it comes to configuring the event, there are some best practices you want to adhere to. To avoid confusion later, Rushton McGregor advises, “When you create a custom event name, I recommend you use lowercase letters and underscores for spaces. You’ll want to set your matching conditions using event_name and additional parameters.”
If you are starting out, GA4 has enhanced measurements that include events such as:
- When someone downloads a file.
- A click to an external site.
- A video view.
Understanding this can help you understand how to configure additional, more granular events.
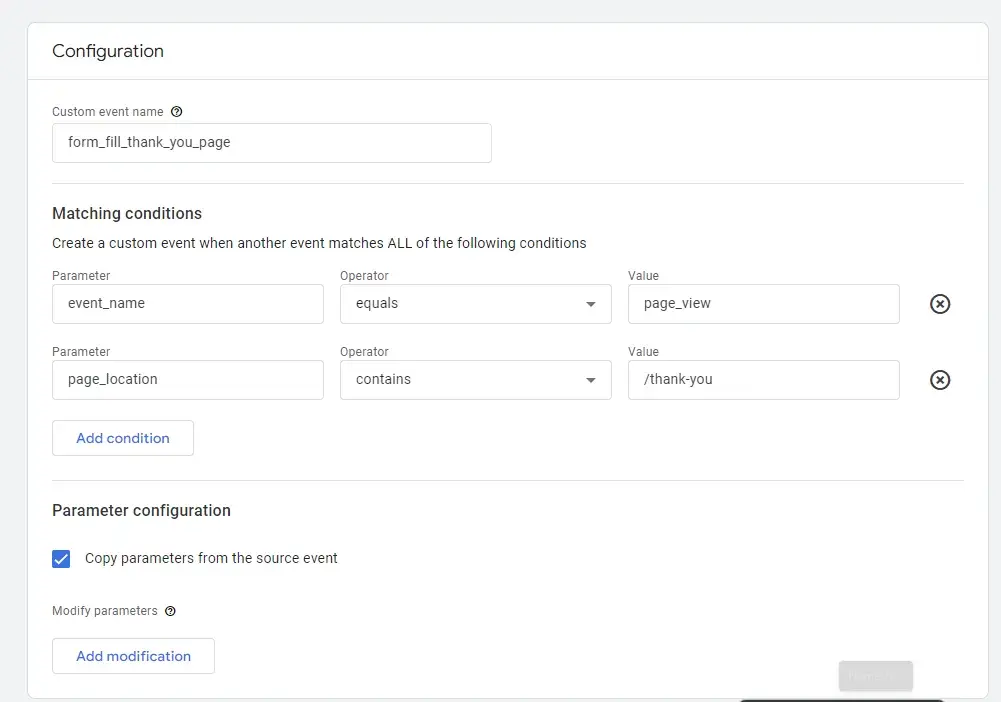
Rushton McGregor provides an example of how configuration looks for a form thank you page filled out.
You can create custom events for a range of actions. For my own sites, I’ve set up:
- Button clicks (only to key buttons on my website).
- Forms filled.
- Downloads.
- Engagement and clicks within specific areas of a site (a blog sidebar, for example).
- And more!
Rushton McGregor provides more examples in his guide to creating events in GA4. His examples include:
- Page views.
- File downloads (I recommend this one).
- Outbound clicks.
Now you’ve got your custom events set up, let’s look at how you can visualize these using GA4’s exploration reports.
Step 3: Build an exploration.
To build an exploration, find the Explore tab in the left-hand menu of your GA4 account. Then, click Free-form.
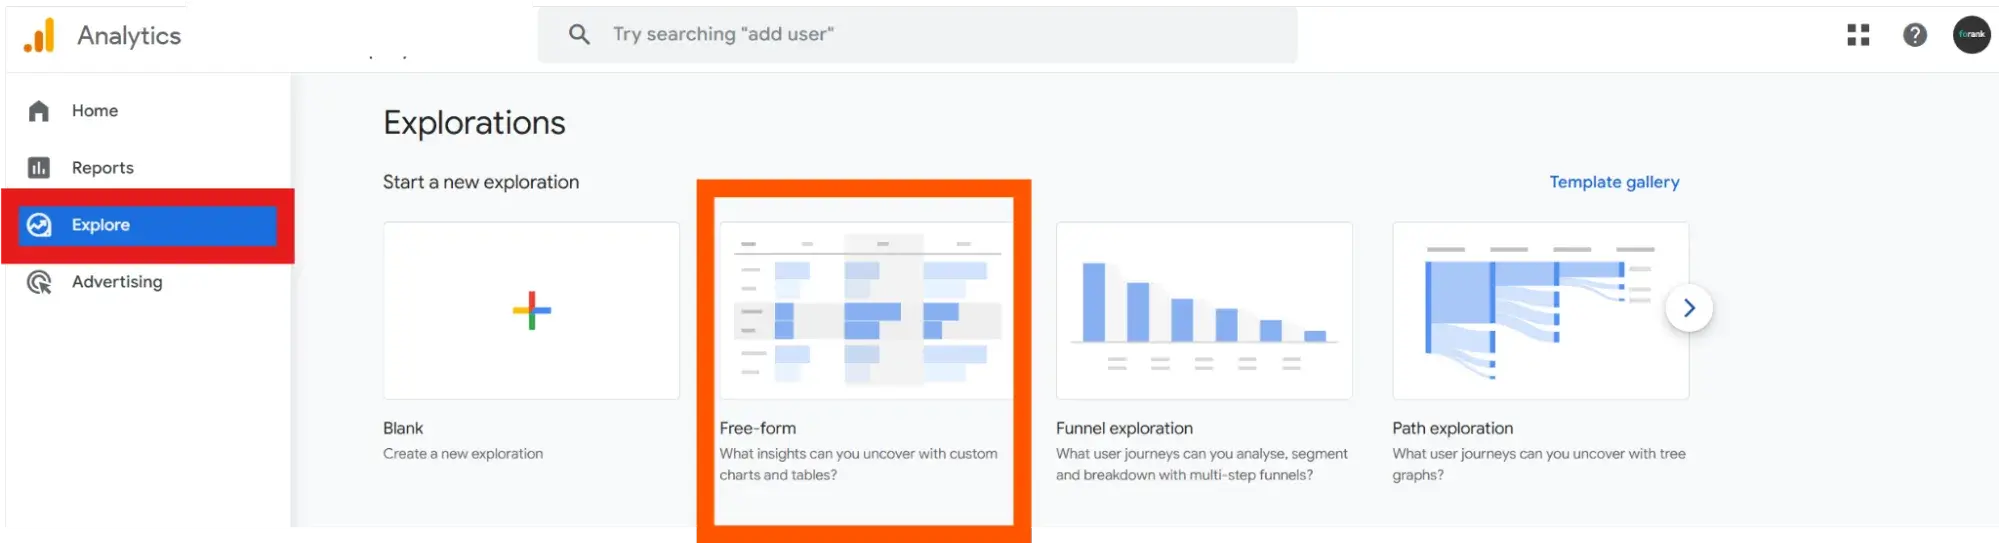
From here, you’ll be presented with options for creating a bespoke exploration where you can see precisely the B2B marketing data that’s most important to you.
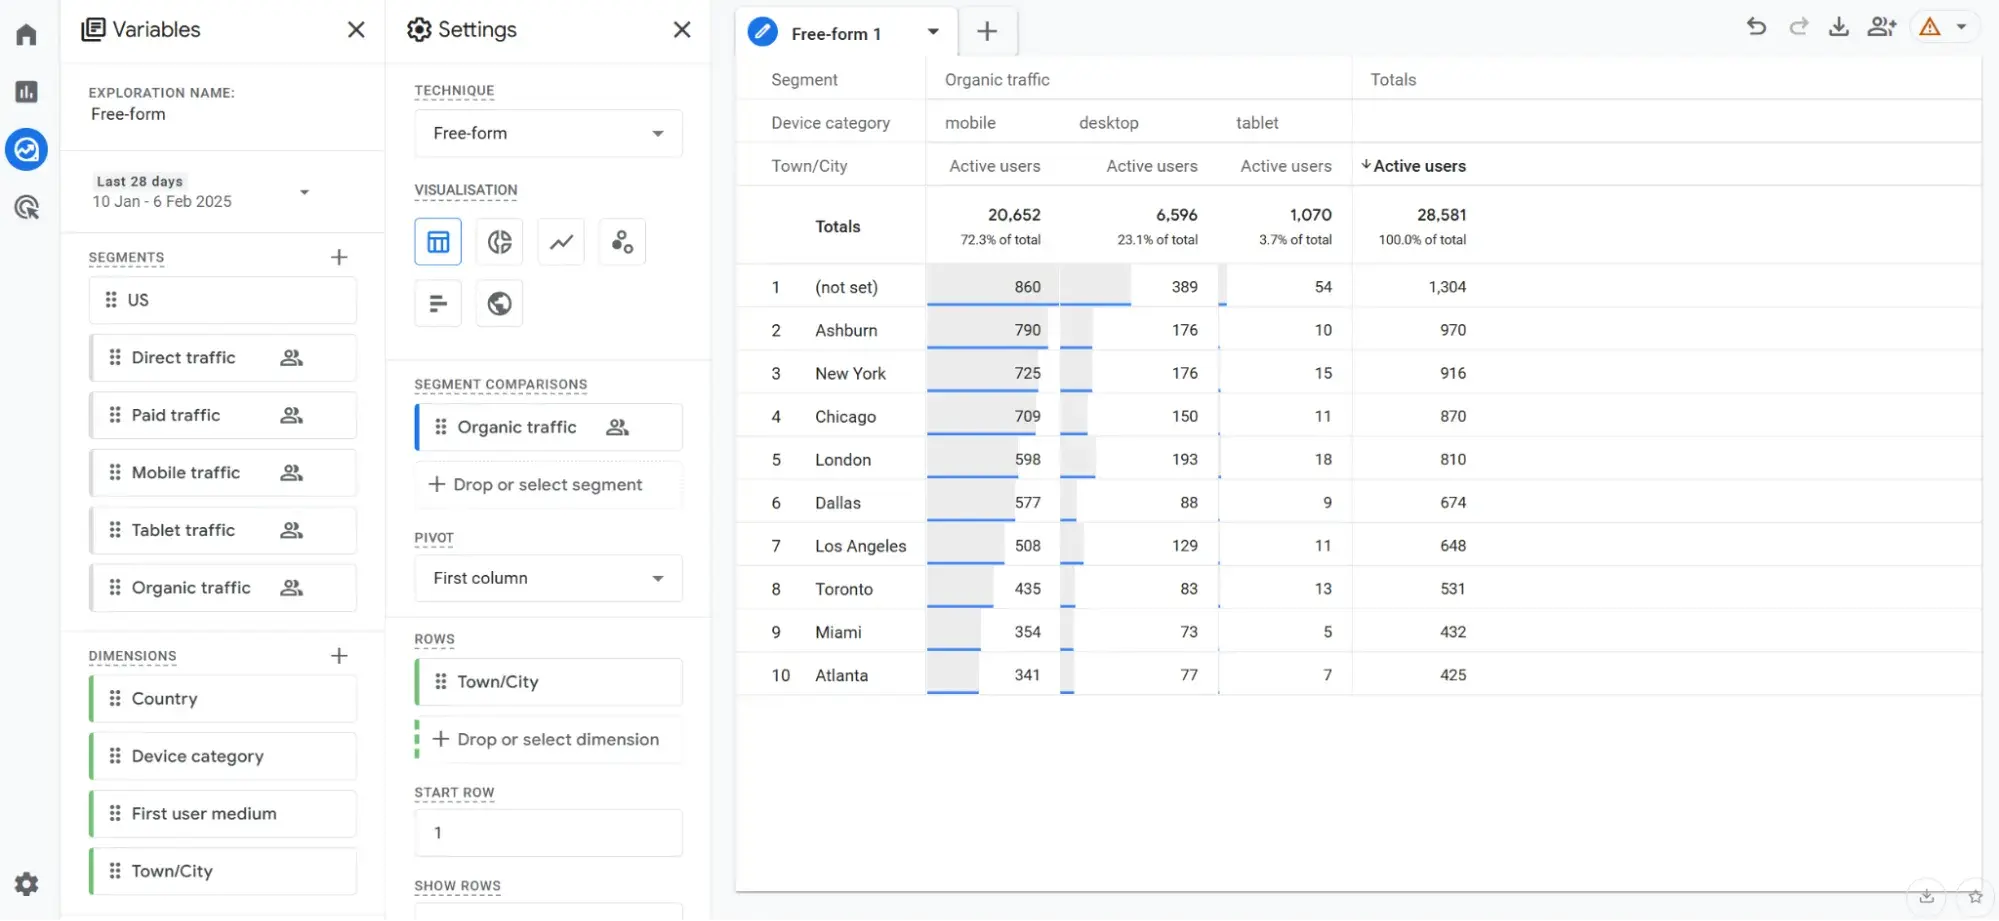
For the purpose of this example, I wanted to show how you might track engagement from particular cities. As you can see in the screenshot below, I’ve pulled in the “organic traffic” segment, so the data is funneled down to organic only, then a row of towns and cities.
From this graph, I can now see where most of my organic traffic is coming from by city.
Step 4: Think about AI traffic sources.
This might not be a must for every business (yet), but I think this report is especially exciting. Rushton McGregor figured out how to pull your views from AI sources. For most businesses, the data won’t be all that impactful yet, but it doesn’t hurt to start tracking this data as a way to future-proof your marketing for when the inevitable switch to AI search happens.
For this report you need to repeat some steps from step one. Make sure you’ve got admin access, then go to Admin, Data display, and Channel groups.
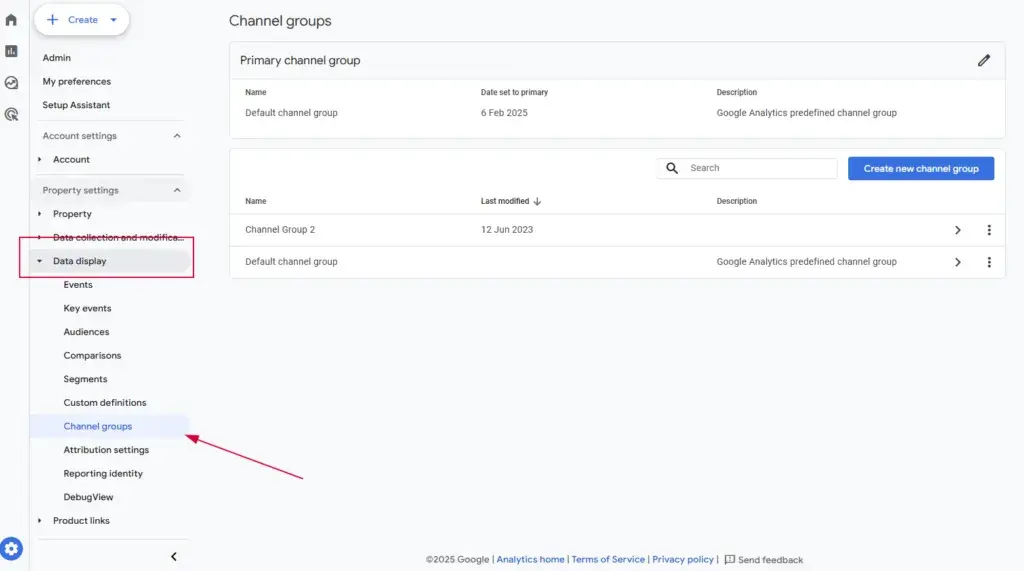
Click Create new channel group.
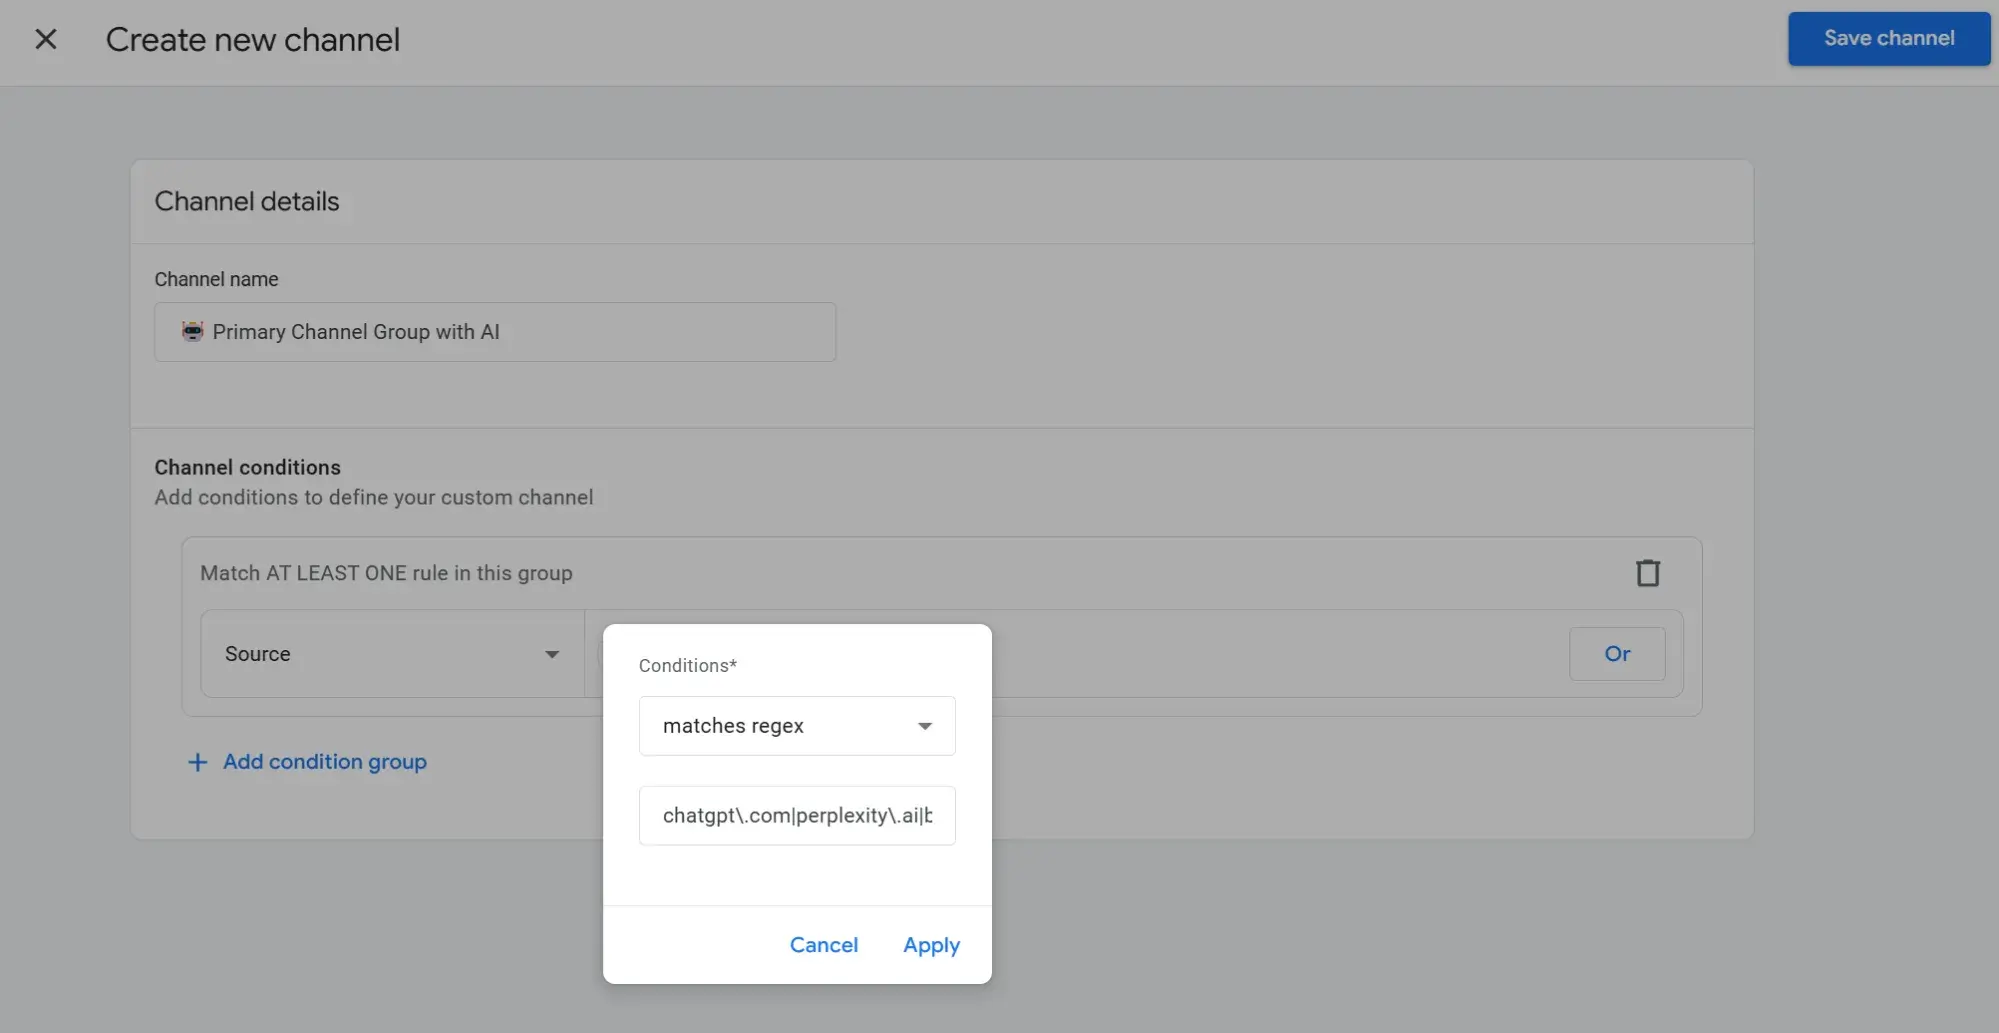
Rushton McGregor advises that you set the condition by doing the following:
- Parameter: Session Source
- Condition: Matches Regex
- Regex Pattern: (Use a regex that includes common AI tools such as chatgpt.com|perplexity.ai|beacons.ai|coursefinder.ai)
Here’s how this looked for me:
Another tip from Rushton McGregor is to reorder the report so your new AI group is at the top. Here’s how I did that:
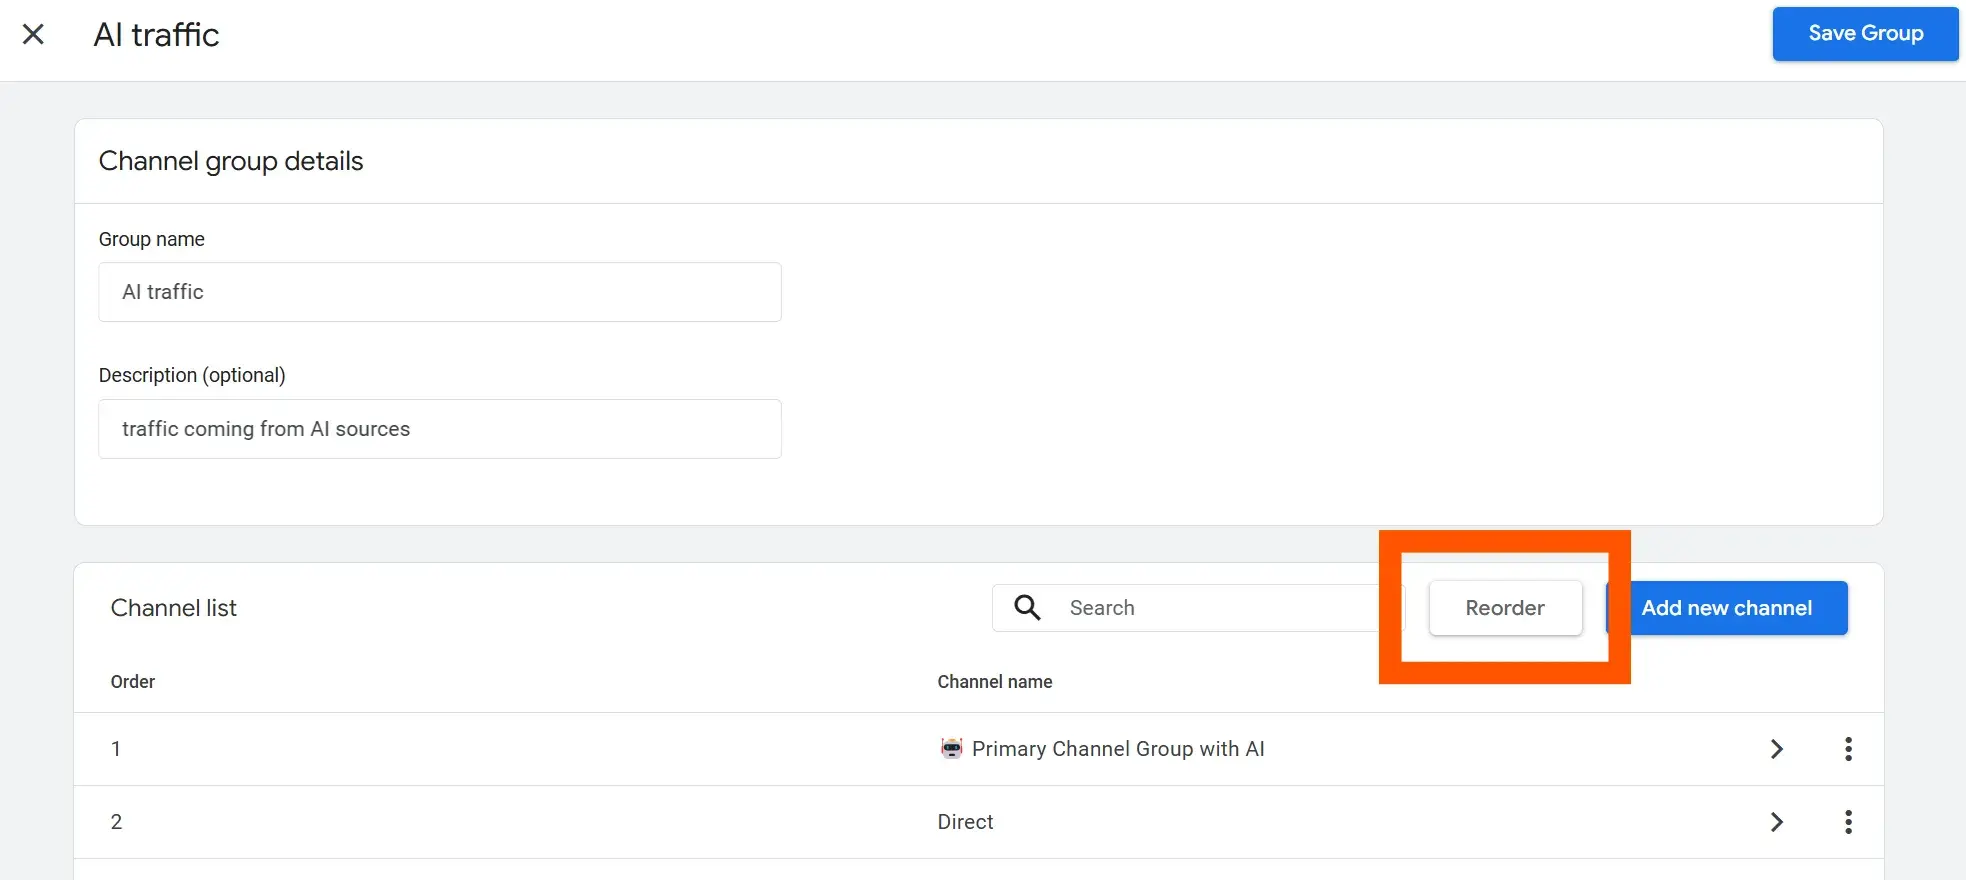
Once reordered, press Save Group.
Finally, you need to click the pencil (pictured below because it took me an irrationally long time to find it).
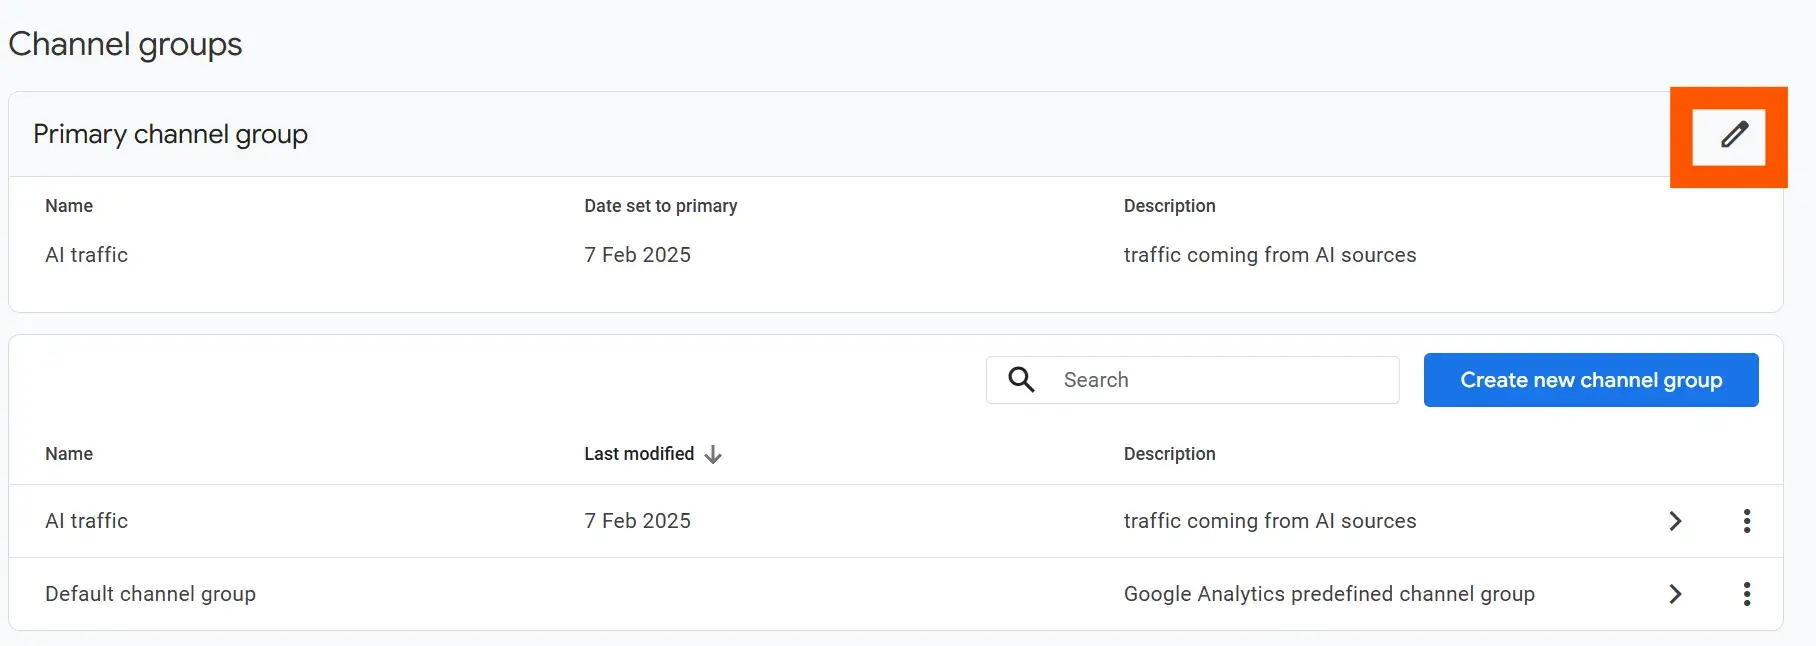
Select Primary Channel with AI as the default.
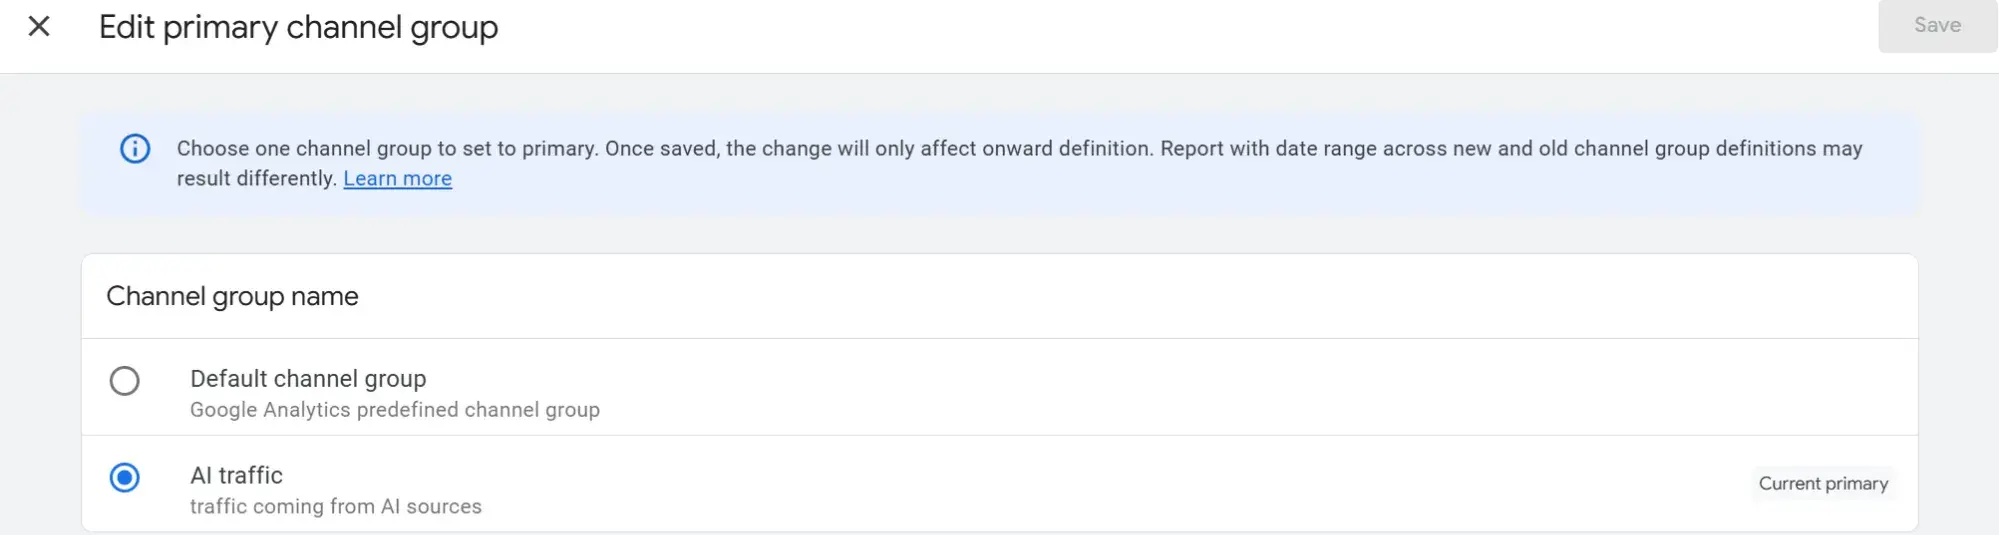
And that’s it! Data should be analyzed in traffic acquisition reports.
Step 5: Have fun with B2B analytics!
B2B marketing analytics can feel intense, no doubt about it, especially when there’s so much you can track, pressures from above, and more.
You want to create reports you love and want to use and reports that feel like yours.
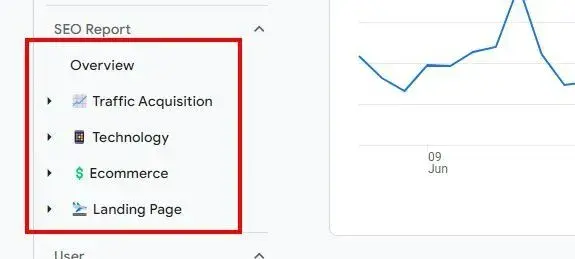
Kyle Rushton McGregor has a final fun tip for making your reports your own. He says, “This isn’t going to change your analytics game, but you can use emojis to make reports in GA4. It’s a great way to add visualization and imagery to brighten up the interface.”
Pictured below is a customized GA4 report that’s as functional as it is fun.
B2B Marketing Analytics Tools
We’ve already mentioned tools above, but in the section below, I’m going to dig into some details. If you want more tool recommendations, I have already written about the best AI tools for B2B marketing. Fair to say, I truly do think these tools are the best because there are a couple of repeats in this shortlist.
1. HubSpot

HubSpot has earned its reputation as a leader in the B2B marketing space. G2 recognizes HubSpot as the number one marketing software, and, as pictured below, the platform received nine G2 awards in 2024.
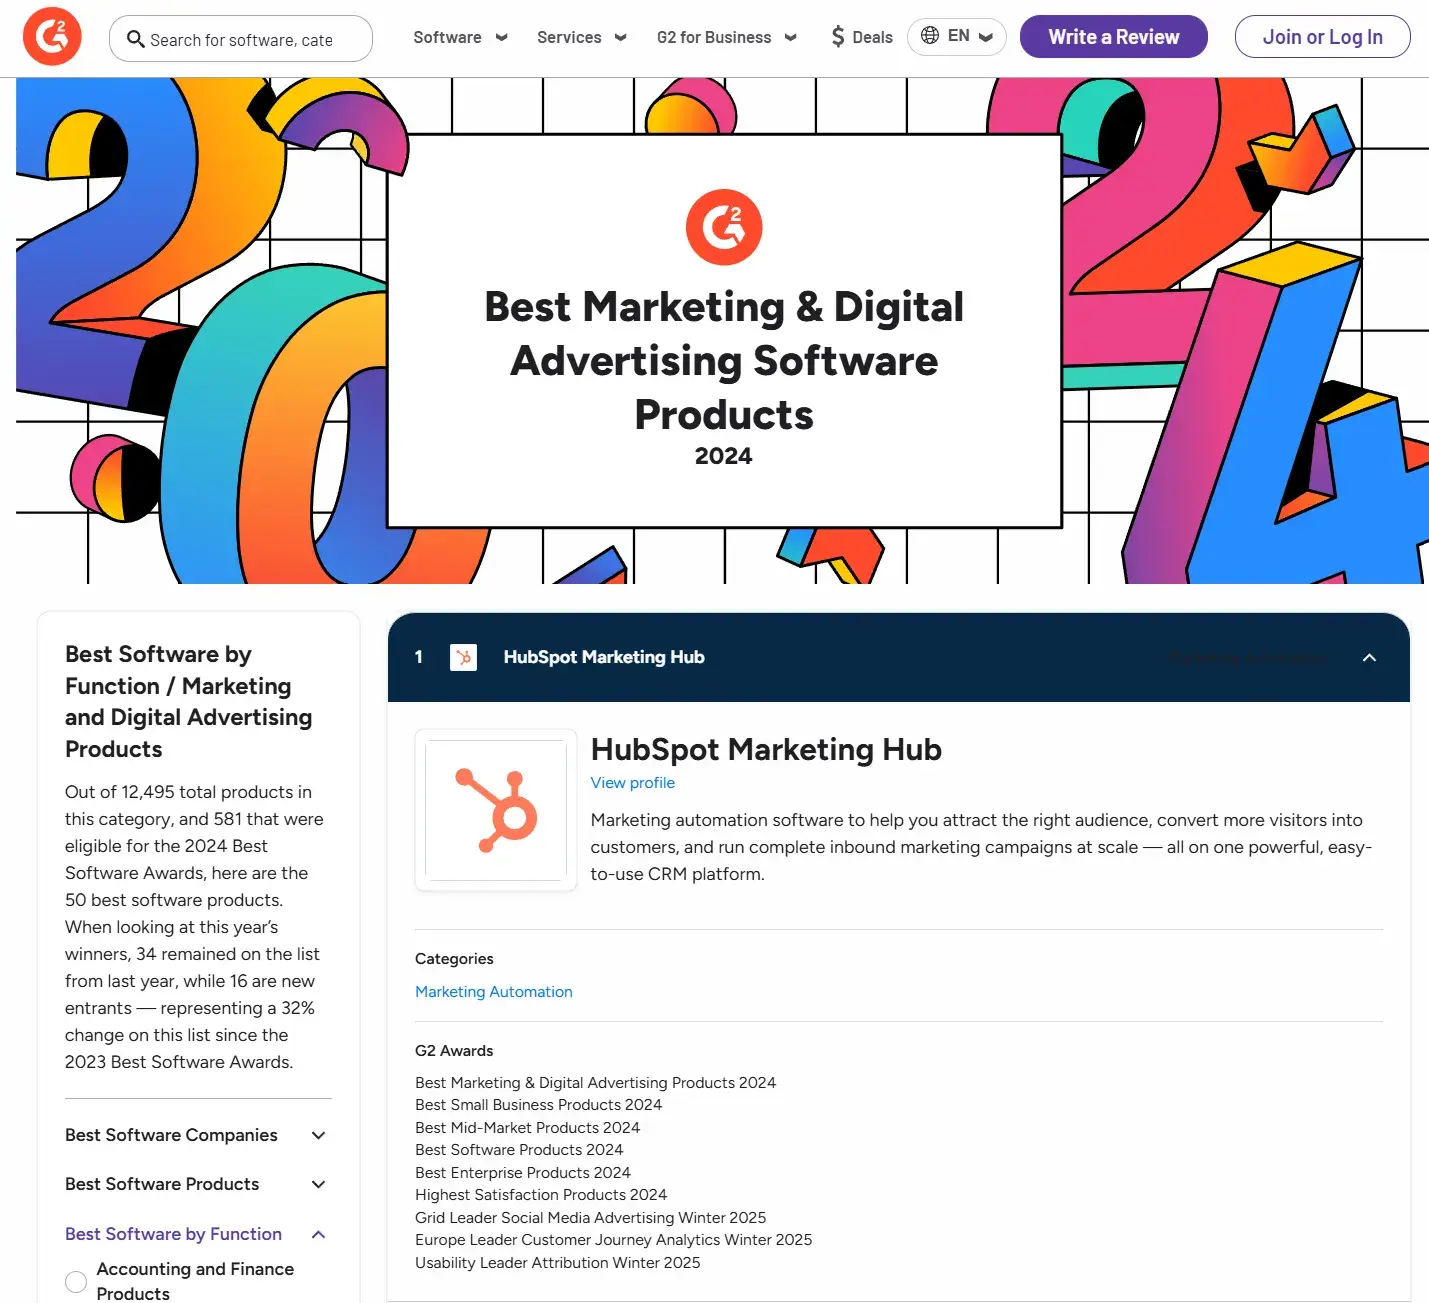
For B2B marketers, HubSpot has everything. I’m going to whittle the features down to some favorites.
CRM With Workflows and Automation
With HubSpot’s CRM, you can set up workflows, monitor prospect engagement, and view customer history and touchpoints. With the data, you can make data-driven decisions about what to do next to close a lead. Better, with HubSpot’s AI, you can rely on the recommended actions delivered to you.
Katherine González Rodríguez, international marketing and partnership manager at WeUni, uses HubSpot CRM to support B2B marketing.
González Rodríguez says, “My favorite marketing analytics tool is HubSpot. WeUni utilized its CRM feature to streamline our lead nurturing process. We set up automated workflows to track engagement and score leads based on behavior, significantly improving our lead qualification process and conversion rates.”
In another insightful use case, Rodríguez’s team applied HubSpot to segment audiences based on engagement metrics. This segmentation allowed them to personalize content and target messaging more effectively, enhancing engagement and conversions.
Customer Journey Tracking
I mentioned customer journey tracking earlier, but Dominick Tomanelli provides tips for tracking engagement metrics with HubSpot.
Tomanelli says, “A great use case we’ve had is tracking the customer journey from the first touchpoint — like an email click or a landing page visit — to the final action, whether scheduling a meeting or making a purchase.”
One time, Tomanelli ran a campaign targeted at mid-sized tech firms. Using HubSpot, he could see exactly which emails were being opened, which links were getting the most clicks, and even how long prospects were spending on our website.
“That level of detail allowed us to refine the messaging in real-time and focus on the genuinely interested prospects rather than wasting resources on a broader, less targeted approach,” Tomanelli says.
Gathering the data is one thing, but I wanted to know what the data meant to Tomanelli. How did he use the data to take action?
He says, “The way I use these insights is pretty straightforward but effective. For example, if we notice that certain content consistently drives engagement — say, a case study or a how-to guide — we double down on creating similar materials.”
On the flip side, Tomanelli says, “We tweak something or pivot entirely if something isn’t resonating. It’s not about perfection; it’s about being adaptive and willing to make changes based on what the data tells you.”
Best for: Any marketing team, big or small, who wants a comprehensive solution with everything in one piece of software.
Pricing: You can get access for free, then pricing increases depending on needs. HubSpot is definitely a platform you can grow with.
HubSpot’s Marketing Hub G2 Ratings: As above, HubSpot is highly rated on G2. At the time of writing this article, the platform has over 12,000 reviews and a rating of 4.4/5.
2. Pardot and Salesforce
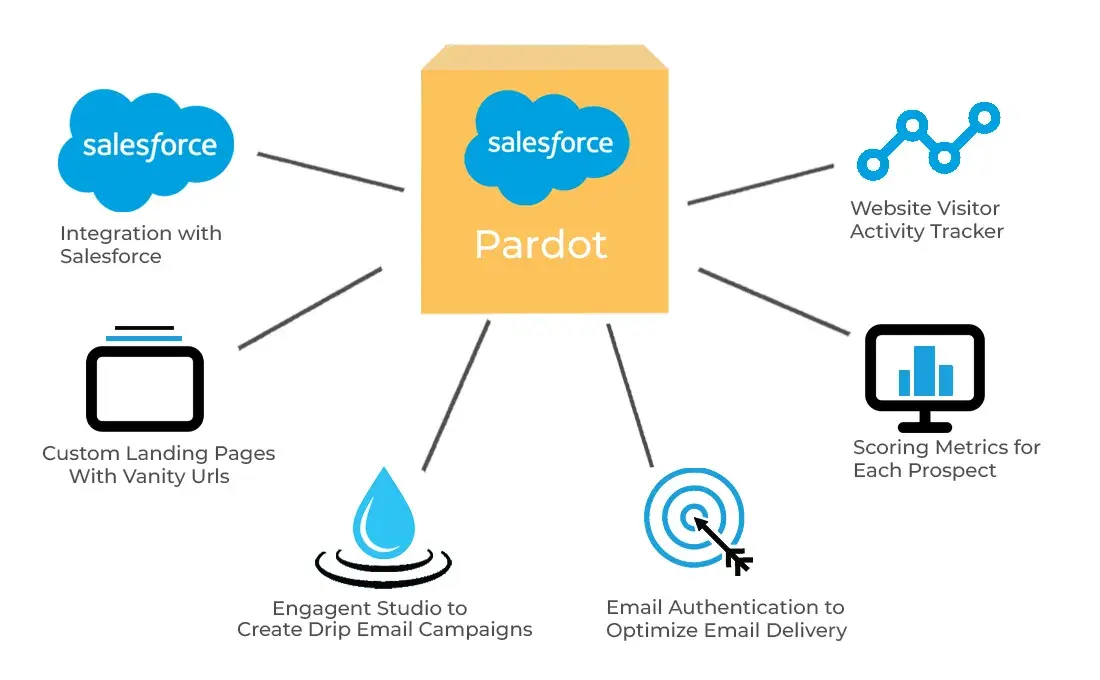
Salesforce Pardot is a B2B marketing automation solution.
Like HubSpot CRM, it is known for providing a range of features for B2B marketers, including lead scoring and grading, as well as engagement metrics. Arthur Favier uses Salesforce to analyze the sales cycle (his recommended metric above).
Favier says, “We combine Salesforce with a platform such as Marketo. One use case that comes to mind is when we discovered that leads from one channel were converting nearly twice as slowly as leads from other channels. That channel didn’t seem to be doing well at first glance.”
However, Favier’s team discovered that those slower leads actually had larger transaction sizes — roughly 35% larger than the average — when they added pipeline data.
“We were able to boost our budget for that channel and modify our follow-up expectations as a result of that information, which eventually raised our revenue without compromising efficiency,” Favier shares.
Best for: Those who are already familiar with Salesforce and want to stay on the platform.
Pricing: Pardot starts at $1,250/month.
Pardots G2 Ratings: Pardot’s ratings are now combined with Salesforce Marketing Cloud Account Engagement. The software has 2,376 ratings and a rating of 4/5.
3. Google Analytics (GA4) & Looker Studio
I’ve already mentioned both GA4 and Looker Studio and how much I like these tools for managing my reporting of B2B marketing analytics.
Google tools are amazing because they are free, and when you consider what you can access with these tools, it is a must-use tool in B2B marketing analysis.
Examples of data that you can analyze in GA4:
- Demographics.
- Engagement metrics.
- Devices and technology.
- Attribution data.
- And so, so much more.
As I’ve shared above with Kyle Ruishton McGregor’s custom events, you can make GA4 your own and make reporting easy with Looker Studio.
As your marketing analysis becomes more sophisticated and you start using tools, you can integrate GA4 with software like HubSpot, bringing all this insightful data into one place.
You will remember Zayed Ahmed from earlier; he recommended tracking customer acquisition metrics. Ahmed relies on GA4 more than any other tool. He says, “Google Analytics is one of the tools I rely on the most. It’s simple but gives you everything you need if you know how to read it.
“Once, I noticed that one of our service pages for virtual assistance wasn’t converting as well as others. The data showed that people were spending only a few seconds on that page before leaving. That’s a clear red flag,” Ahmed recalls.
Ahmed dug into the page and realized the problem — there was too much text, and the specific services the company was offering seemed unclear. He simplified the content, added a FAQ section, and made the contact form more obvious. Within a month, they page saw a noticeable increase in inquiries.
“I will caution that although GA4 is amazing, it can only gather data from those who accept cookies, so you never get all of your data in GA4. If you’re using GA4 to track revenue, for example, you’ll find that GA4 likely underreports on revenue,” Ahmed says.
When it comes to GA4, you don’t want to see stats off by more than around 10%. If you see a disparity of more than 10%, then it might signal there’s an issue, Ahmed notes.
Best for: I’ll say it again, everyone should be using GA4 and Looker Studio. They’re free, and there’s nothing to lose, and everything to gain.
Pricing: Free.
4. Semrush
I’m surprised I’ve reached this point before mentioning Semrush, honestly! I love it and use it almost daily.
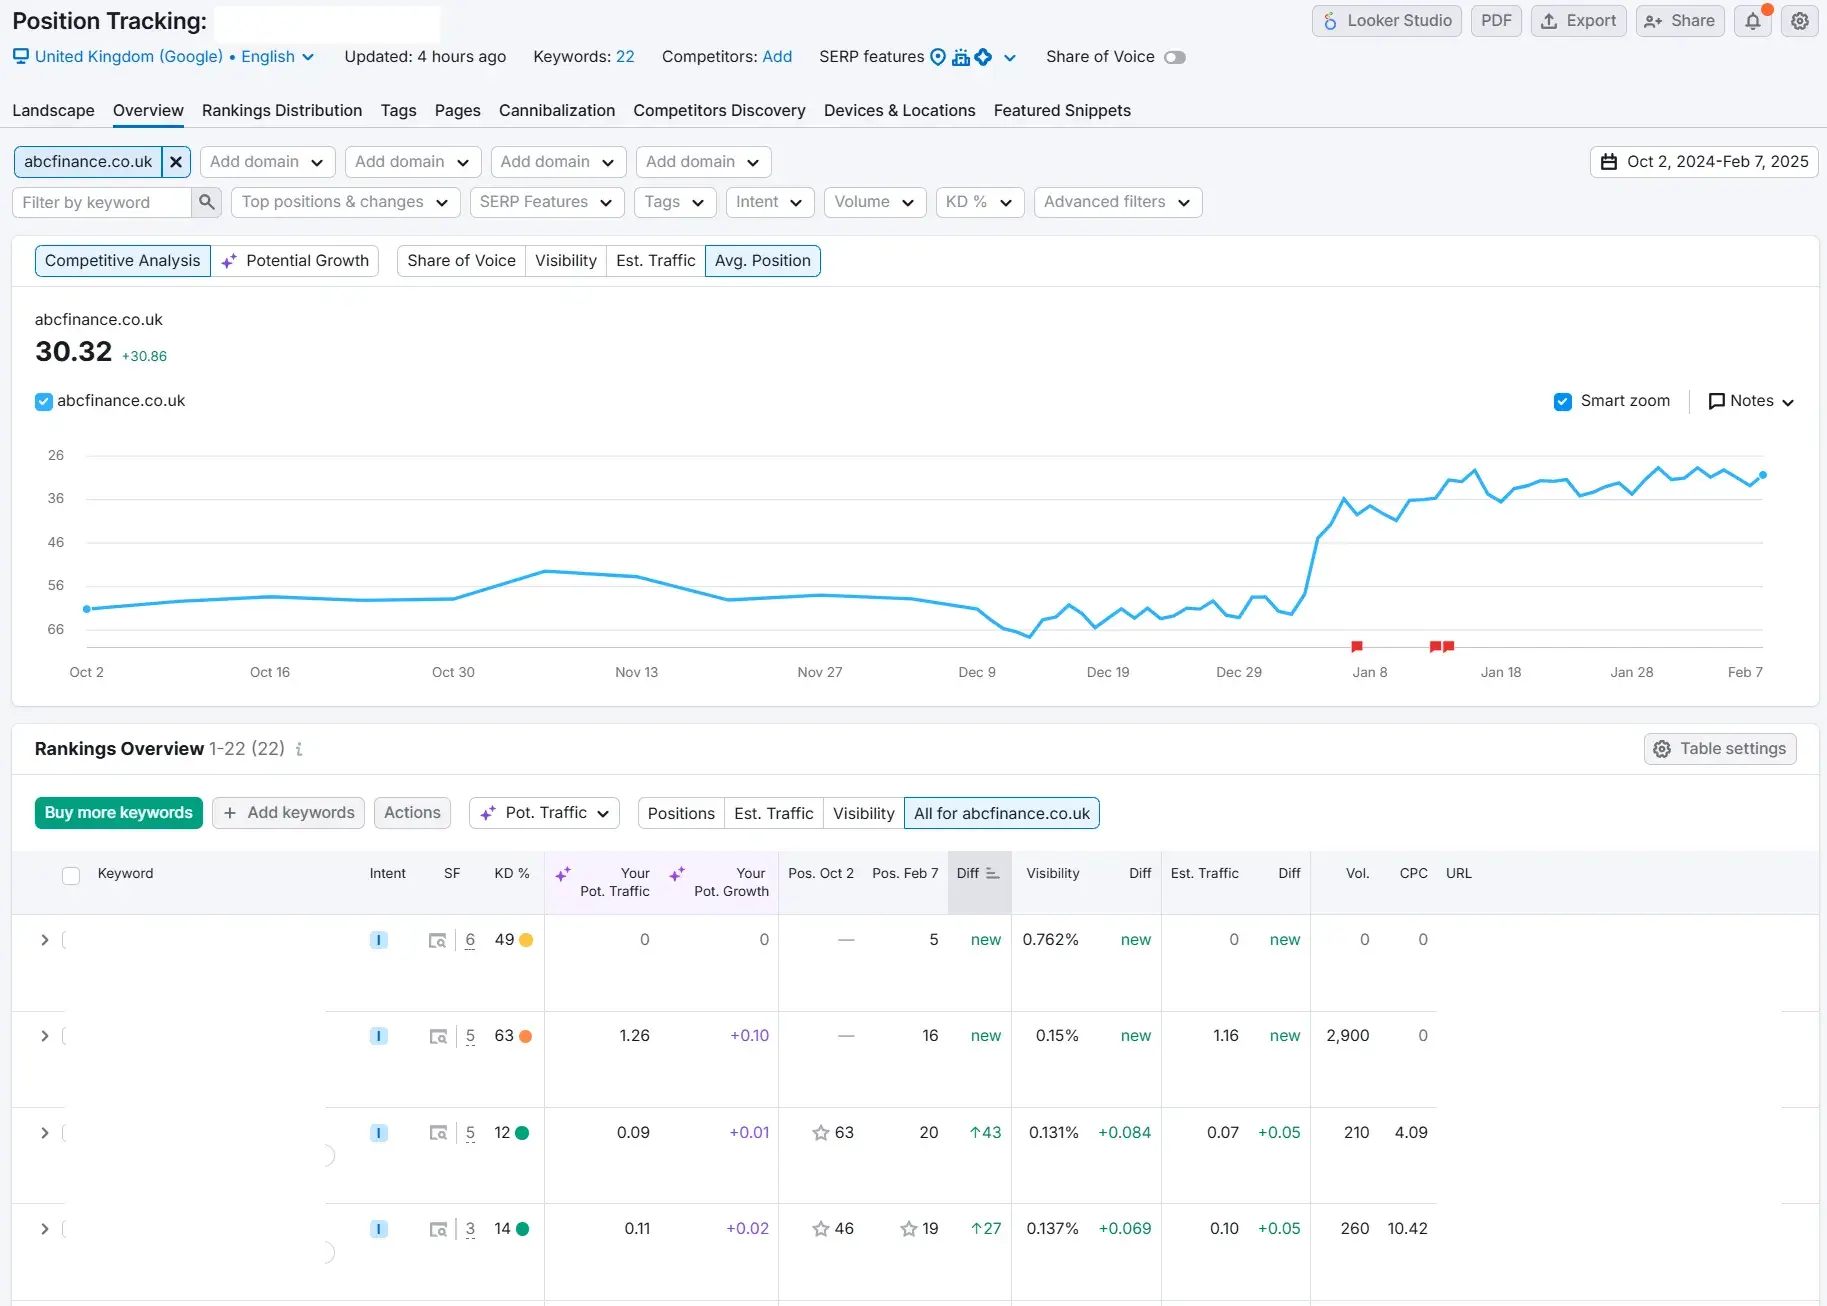
Semrush is great for SEO and competitor research related to SEO. You can use the tool to maintain your website, too.
The screenshot above is a picture of the position tracking graph for one of my clients. I like tracking keywords with Semrush because I can easily track specific keywords. I can also make notes about changes I’ve made that may influence position (see the red notes at the bottom of the graph).
Other benefits of Semrush include competitor analysis and the website health check.
Zayed Ahmed also rates Semrush highly.
He said, “I’ve learned that chasing high-competition keywords doesn’t always work. Instead, I focus on specific phrases that potential clients might search for, like ‘outsourcing back-office tasks for startups.’ These keywords might not have as much traffic, but the people searching for them are usually the ones ready to make a decision.”
Best for: Businesses who are very serious about SEO. Although you can also monitor website health, track keywords, and do competitor analysis, I feel a company would want to be serious about SEO to justify the price.
Pricing: For tracking up to five projects and 500 keywords, Semrush is $139/month. For businesses with one website, this will likely be the most suitable package, but if you want to increase trackable keywords or report results, the Guru package is $249.95/month.
Semrush’s G2 Ratings: Semrush has a rating of 4.5/5 and has been rated by 2,411 people.
5. Microsoft Clarity
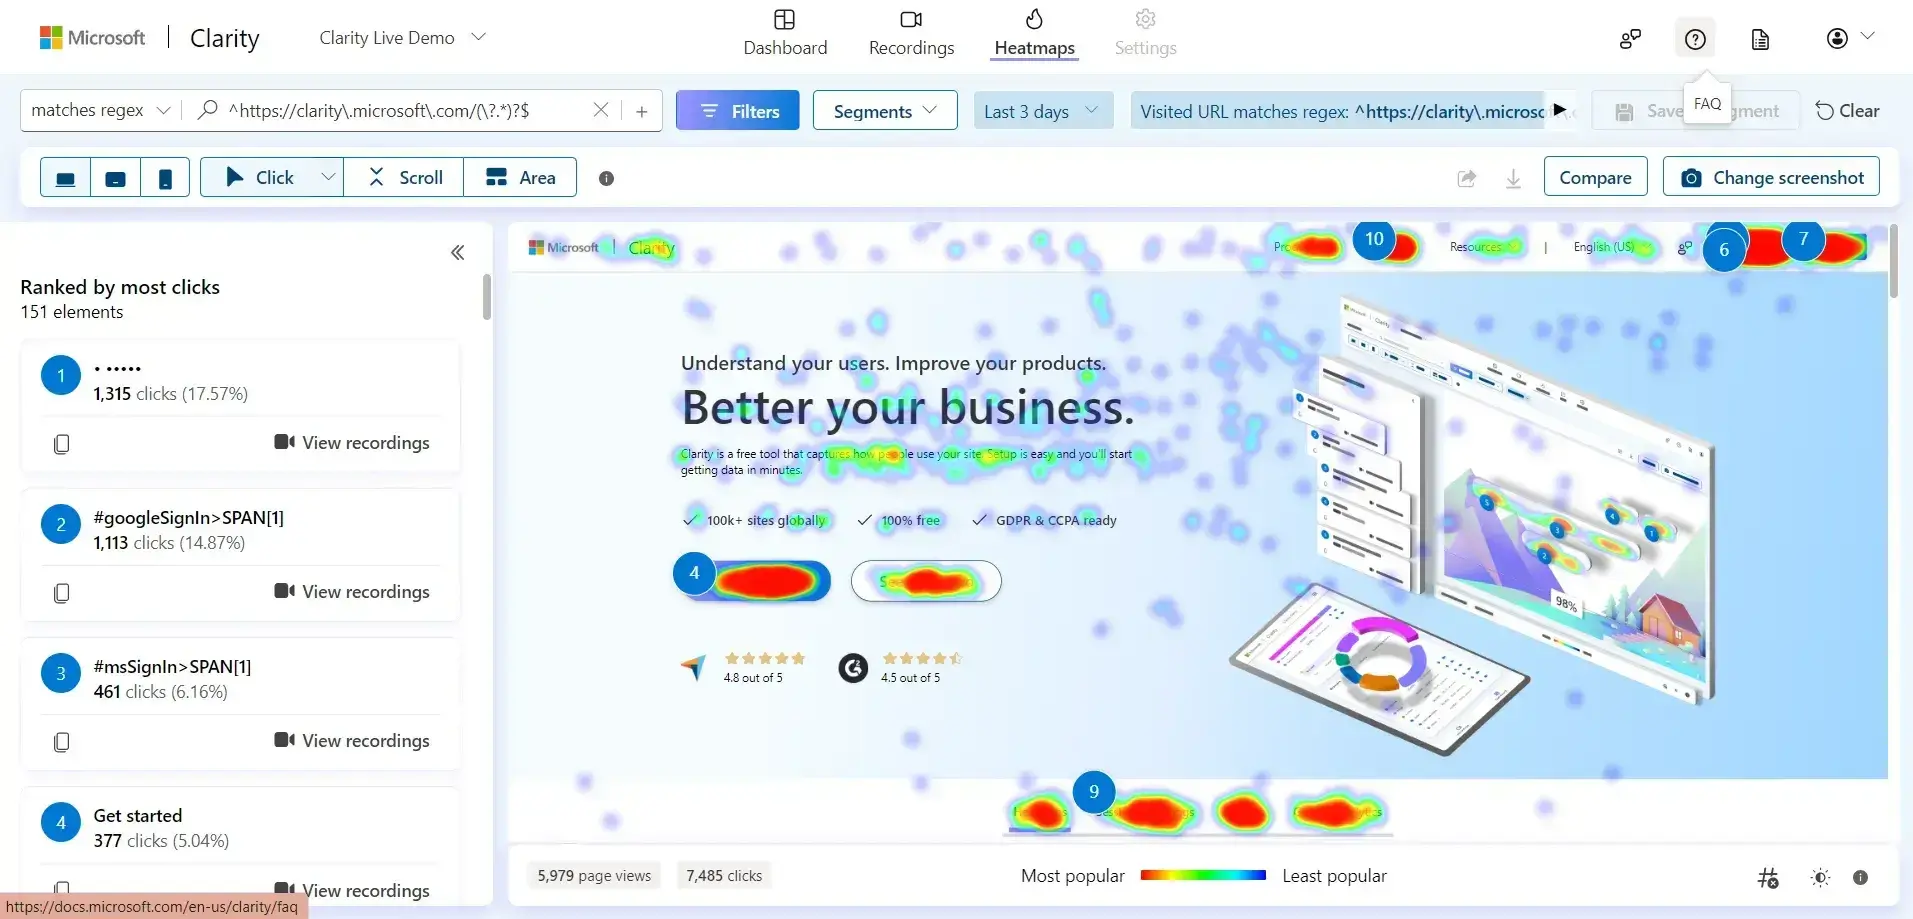
Microsoft Clarity is an excellent tool, and it’s free, so why would you not use it? I’m not the only one that rates Clarity highly for B2B marketing.
Collins Agbonghama is a web developer at Profile Press. He also recommended Microsoft Clarity.
Agbonghama says, “Knowing how visitors use a website, such as how long they stay, what they click on, and how they move towards making a purchase, can help you improve your site to keep them interested.”
Microsoft Clarity is a free tool for analyzing site interactions. It provides heatmaps highlighting the most viewed parts of your pages, helping you place important information where it’s most effective.
Session recordings let you watch how users navigate your site so you can spot and fix any issues. Clarity also tracks clicks and scrolls, showing which buttons or links get the most attention. “This information helps you understand what works well and what needs improvement, leading to better user experiences and more successful marketing efforts,” Agbonghama notes.
I strongly agree with everything Agbonghama says. I’ll add that screen recordings are fascinating. You can see in real-time where users are most engaged and where they might be struggling. You can also filter to your most important pages to see behavior on particular areas of your site. Starting with an analysis on those money-generating pages is my recommendation.
Clicks and scroll depth are also interesting. Below is a picture of what that looks like.
Best for: All businesses. It’s free, it’s useful, it’s a must-have.
Pricing: Free
Clarity’s G2 ratings: I’m really surprised to report that Clarity, a free tool, only has 37 reviews. It’s rated at 4.5/5.
6. Dreamdata
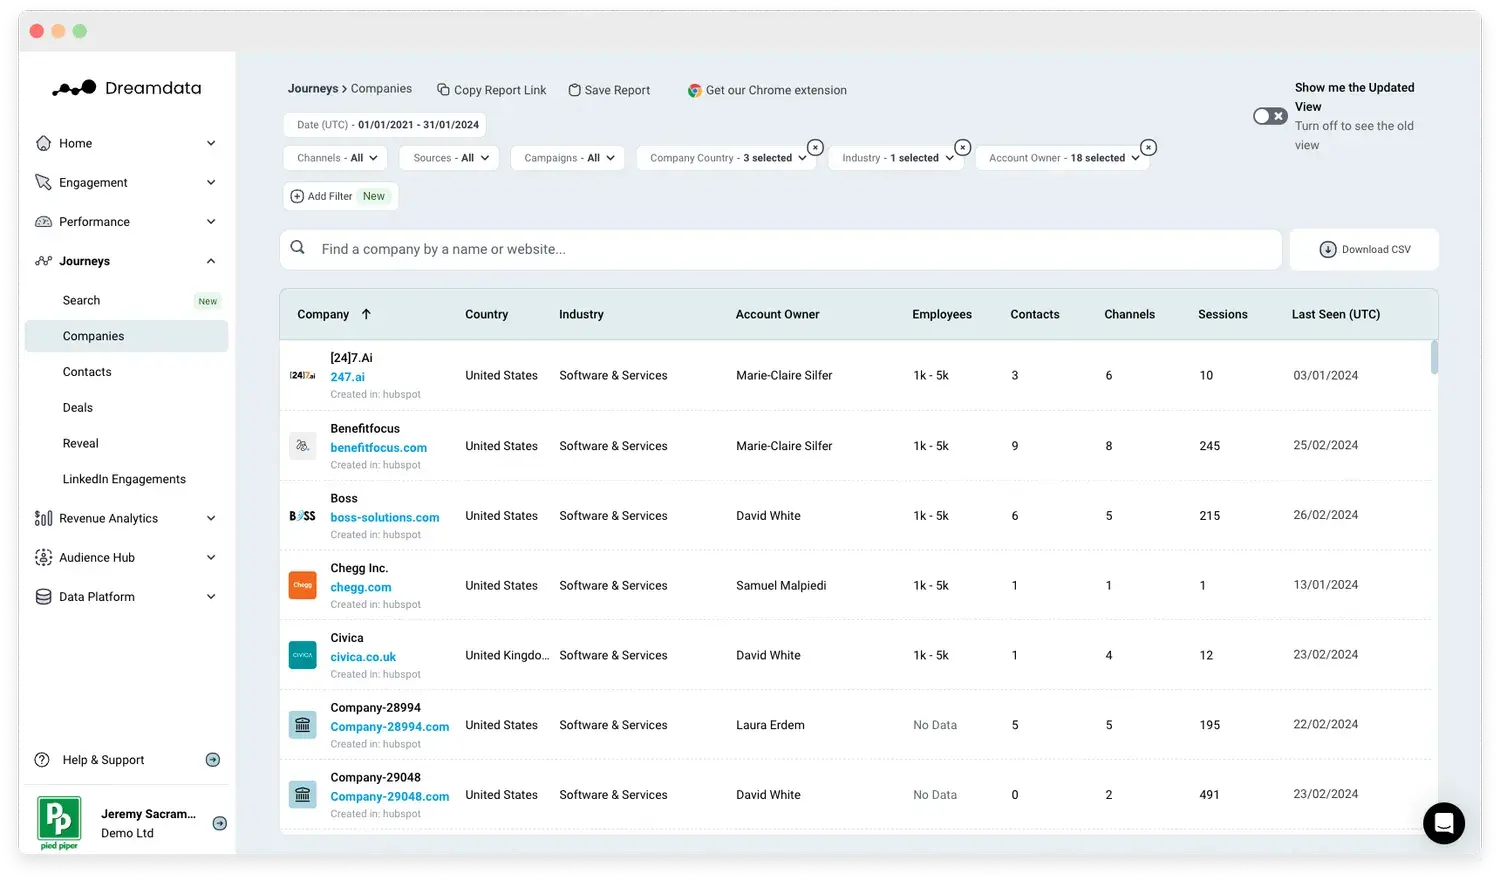
Dreamdata is an incredible team. I was first introduced to Dreamdata because a client had it set up. My co-founder, Leigh Buttrey, got to grips with this tool immediately, and she loves it even more than I do.
The tool is brilliant at helping B2B businesses understand and optimize their sales cycles. It offers insights into lead behavior, including touch points throughout their entire journey.
Buttrey used this tool to close the loop on over $320,000 worth of proposals and, thanks to the tool, was able to attribute the proposals to her ad work. We also knew who the leads were and that they were qualified.
Best for: Businesses who want to focus predominantly on attribution.
Pricing: Free
Dreamdata’s G2 ratings: 194 ratings and a score of 4.7/5.
Track the B2B Marketing Analytics That Matter Most to You
When I started writing this article, I wasn’t expecting to write much, but there is a lot to say regarding B2B and marketing analysis. I could’ve written so much more!
As a B2B marketer, I had a lot to say; it is my passion, after all. However, even after 10 years in marketing, I do not know it all, so hearing from other B2B marketers and how they manage and analyze data was a great pleasure.
If I could remind you of one thing, it would be this: Do not get daunted by marketing analysis. Think strategically about the right metrics for your business, and start by tracking the essentials only.


Your insights into B2B marketing analytics resonate with me on several levels. It’s fascinating how much storytelling can emerge from numbers, and I agree that this aspect often gets overlooked in the analytics community. Using tools like Google Analytics and Looker Studio not only streamlines the reporting process but also adds a layer of creativity to presenting data.