
Google Search Console is the best data source for tracking the traffic you are getting to video content on your website from Google search, as it provides data directly from Google about the queries actually driving traffic, and can be segmented by video search specifically.
In this post, we’ll provide a quick summary of how to use Google Search Console to track video SEO. We’ll also post a link to a Looker Studio Dashboard template which you can plug your search console data directly into.
Ensure your videos are indexed
Before you can track performance, you first need to ensure your videos are indexed and recognized by Google Search Console. If you want to know how to do this, check out our guide about how to use the video indexing report.
Find your search results
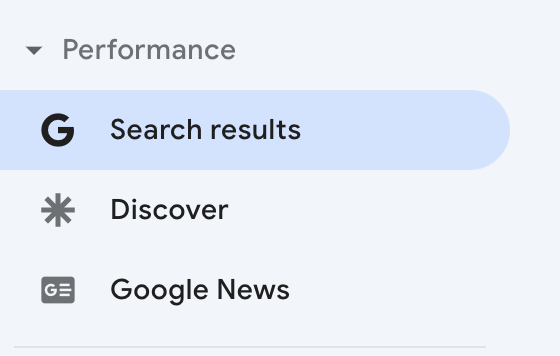
Navigate to search results in the performance menu. This is the report which holds the data you can use to measure the performance of your videos in search. It can be found in the sidebar of Google Search Console.
Measure the performance of video results in Universal Web Search
Once the report has loaded, scroll down to the table below. Its default setting will be queries, so select the “Search Appearance” tab. You’ll see a list that shows the types of results offered in Universal Web Search.
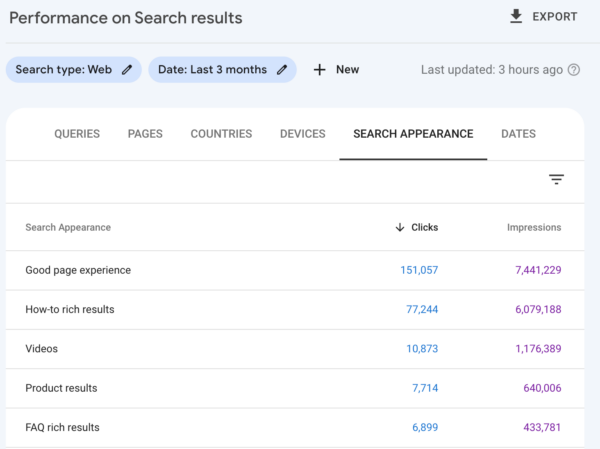
In this list, you should see “Videos”. This refers to rich video snippets shown individually or as part of a video pack within Universal Web Search. If you click on “Videos”, the graph at the top will offer a refined view.
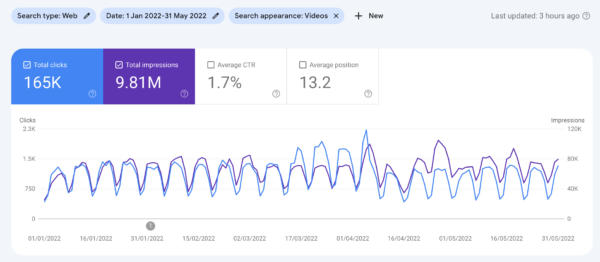
Note that you can only get an aggregated metric that combines traffic from all video queries and pages at the moment. While this report is useful for benchmarking, it isn’t great for a more granular analysis of your performance of video results.
Measure the search terms driving traffic in Google Video Search
Above the graph controls, you’ll see boxes that allow you to segment and refine the data. Click on “Search Type: Web” and select “Video”. The graph and table will now adjust to only show queries that drive traffic from video search, so the video tab in Google.
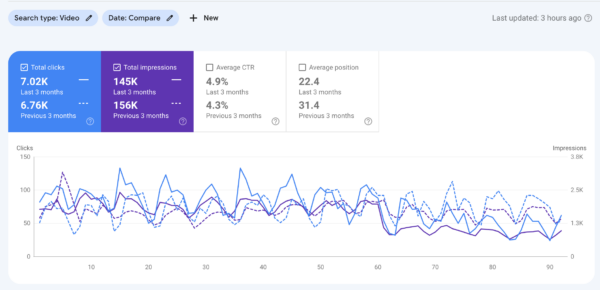
You can then adjust the date range to compare different time periods. You’ll be able to see how traffic and impressions have changed over time.
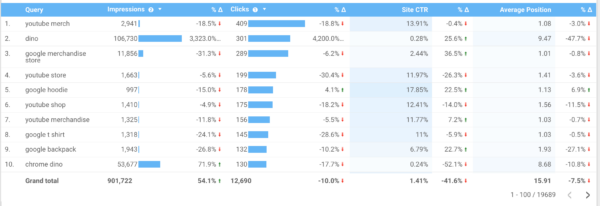
Scroll down the list of queries to find the terms that drive the most traffic from video search. This will be reported as “Organic Video” in Google Analytics 4. These terms can be exported and organized in a spreadsheet or database, so you can track the keyword-level performance of video content.
Measure the pages receiving traffic from Google Video Search
With “Search Type: Video” selected, you can navigate to the “Pages” tab in the table. It will display a list of pages that drive the most traffic from video search.
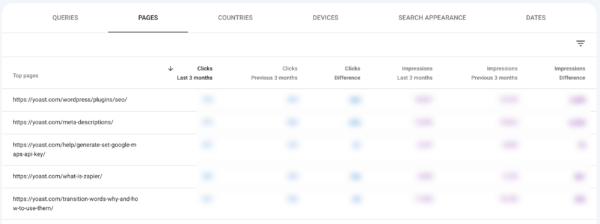
This is particularly useful if you have the same video embedded across multiple pages and wish to see which URLs are ranking most frequently.
Move the data to a Looker Studio report
While the data within the Google Data Studio interface is really useful for gaining a snapshot of your video SEO performance, it becomes particularly valuable when you move it into a setting where the data can be segmented in more detail. Looker Studio (Formally Google Data Studio) is great for this. And to make it easier for you, we have created a Video SEO Performance Report Template. Simply make a copy of this template, then plug and play with your data.
One of the great benefits of this report is the addition of click-through-rate analysis to query and page-level data in video searches. Click-through rate tells you how appealing your video title and thumbnail are for any given query. So what does a low click-through-rate mean? First, it’s important that you compare the rate to other pages or queries. If it’s still the lowest, that usually indicates that your thumbnail could be improved. You can then use the pages with higher click-through-rates as inspiration to understand what types of titles and thumbnails are working.
Track your video SEO performance
Knowing which videos perform well and drive a lot of traffic is really useful. Because it tells you what people want to see. So if you use this information when you create your content planning, you’ll be able to make more videos that your audience will love. So dive into Google Search Control and look at those numbers! And if you’re serious about using video to drive more traffic to your website, you give your videos the best chance of ranking by using the Yoast Video SEO plugin!
The post How to track video SEO performance using Google Search Console appeared first on Yoast.


Recent Comments