![3 Tools to Use Instead of Facebook Analytics [2023 Edition]](https://localseoresources.com/wp-content/uploads/2022/11/facebook-analytics-1-620x361.png)
As we head into 2023, Facebook remains the world’s most-used social media platform – by a long shot. It might not get the press of TikTok or Twitter, but with nearly 3 billion global active users, its reach is still simply unmatched.
With such a large potential audience, Facebook can seem a little overwhelming – how do you know what works and connect with your community on such a giant platform? Facebook analytics are a critical tool to help answer these questions and ensure you build a Facebook marketing strategy that works for your brand.
Bonus: Download a free guide that shows you how to save time and money on your Facebook ads. Find out how to reach the right customers, lower your cost-per-click, and more.
What are Facebook analytics?
Facebook analytics are the data and tools you need to track your brand’s performance on the world’s most popular social network.
Tracking Facebook analytics helps you understand your past Facebook performance and tweak your future strategy. You can use the data you gain through Facebook analytics to create a Facebook-specific report, or build it into an overall social media report that tracks the performance of all your social accounts.
Reviewing your Facebook analytics is also an important way to understand your audience. There’s a veritable treasure trove of data available to help reveal exactly who is engaging with and following your content, with demographic and geographic data that covers age, sex, location, and more.
All of this can help you either refine your content to reach the audience you want, or pivot your strategy to even better engage the people who are already tuning in.
Facebook analytics tools
Facebook used to have a native analytics tool called, appropriately enough, Facebook Analytics. That tool was discontinued in 2021, but there are still plenty of ways to access your Facebook analytics data.
1. Meta Business Suite
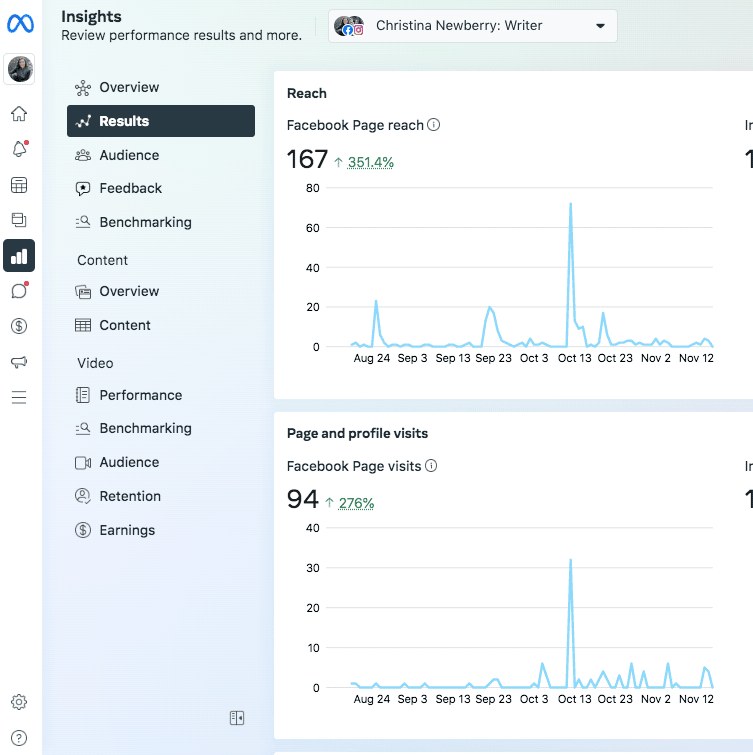
Meta Business Suite has replaced Facebook Analytics as the native tool to access analytics for Facebook. Here, you can see metrics, trends, and visual reports to help you gain insights about your overall Facebook account or individual posts.
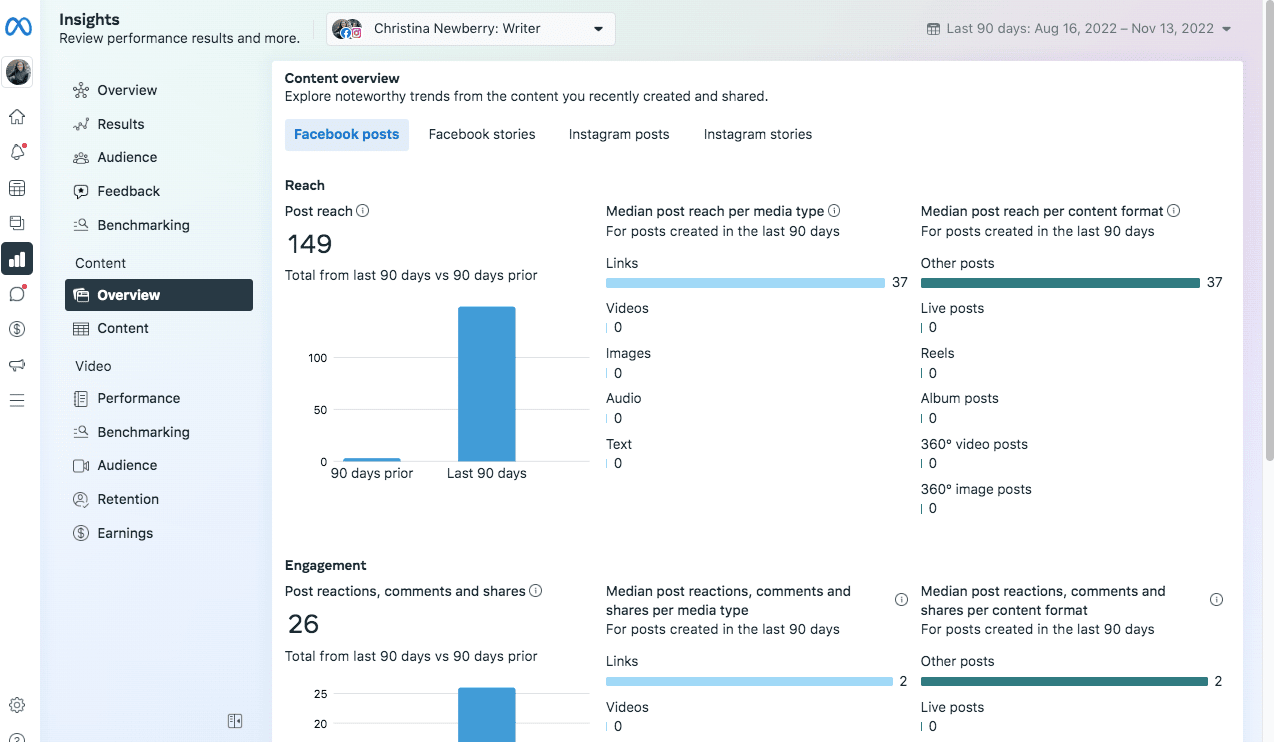
Here’s how to find your Facebook Analytics in Meta Business Suite:
- Open Meta Business Suite and click on Insights. On the overview screen, you’ll see top-level insights for Facebook on the left of the screen and Instagram on the right.
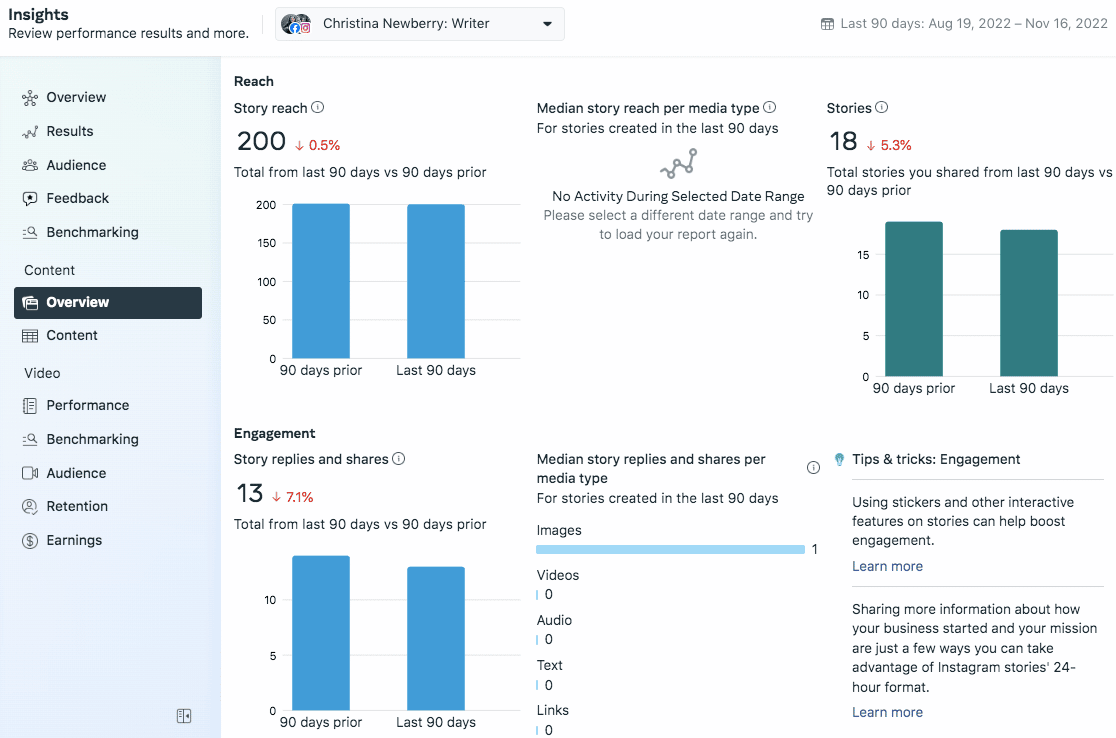
- Click on any of the categories in the left menu to get more details of your Instagram and Facebook metrics.
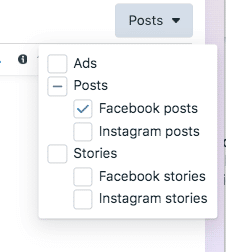
- To look specifically at Facebook content metrics with no Instagram data to distract you, click on Content in the left menu under the Content heading. Then, open the Ads, Posts, and Stories drop-down menu and uncheck the Instagram options.
2. Facebook Page Insights
Facebook Insights is now part of the Meta Professional Dashboard. Here you can review basic insights about your Page, posts, and audience. The data here is quite basic and does not go back very far in time (from a max of 28 to 90 days) but can provide a good quick overview of what’s happening with your Page.
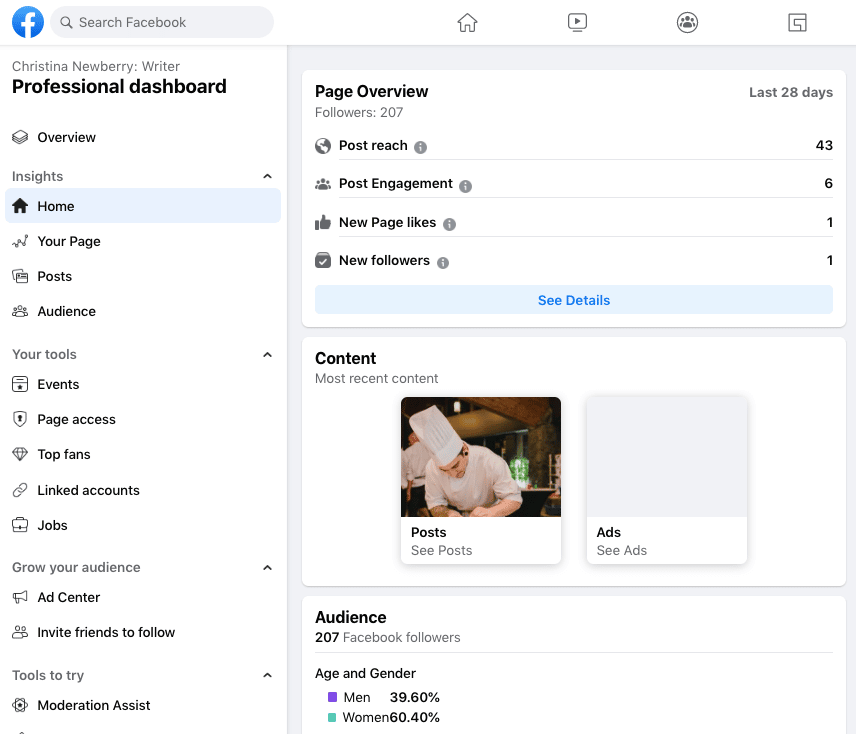
To access Page Insights:
- From your Facebook Business Page, click Insights in the left menu under Professional Tools.
- Click on Your Page, Posts, or Audience to find the metrics you’re looking for.
You can also access very basic insights about each post directly from your Facebook Page. Click See insights and ads under any post to bring up a pop-up with insights specific to that post.
3. Hootsuite
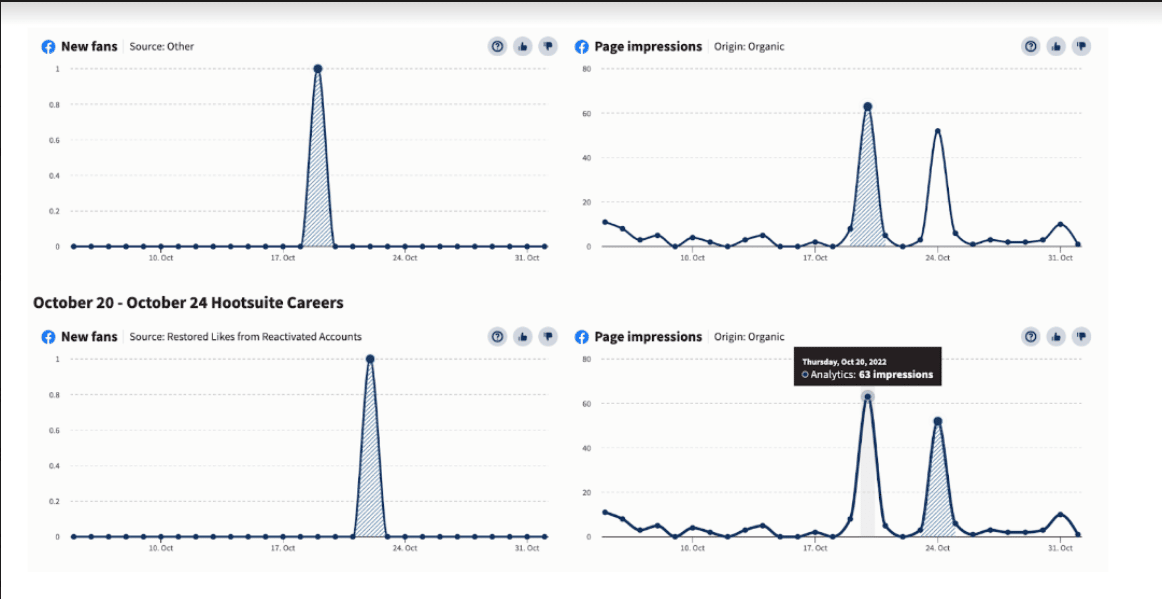
Hootsuite is a social media management tool that includes advanced (but super easy to use) Facebook analytics.
Hootsuite’s Analytics track your Facebook data in detail alongside your results from other social accounts. This simplifies your social media analytics work. It saves time and makes it easy to compare aggregate results across networks.

Fun fact: The vast majority of people who use Instagram and TikTok also use Facebook. You’ll find 82.9% of Instagram users and 83.4% of TikTok users on FB.
Comparing results across platforms is the only way to understand what your audience expects from you on each platform, and how best to connect with them in each context. Hootsuite Analytics allows you to see how your audience responds on each platform so you can better understand where your Facebook and social media marketing efforts fit into the bigger picture.
That said, if you prefer to focus specifically on your Facebook results, you can also use Hootsuite Analytics to dive deep into all the Facebook metrics that matter most to your business. You can then create and export a custom report, or schedule reports to automatically deliver the data to your inbox. You can use the sharing options to automatically share with colleagues and stakeholders throughout your organization.
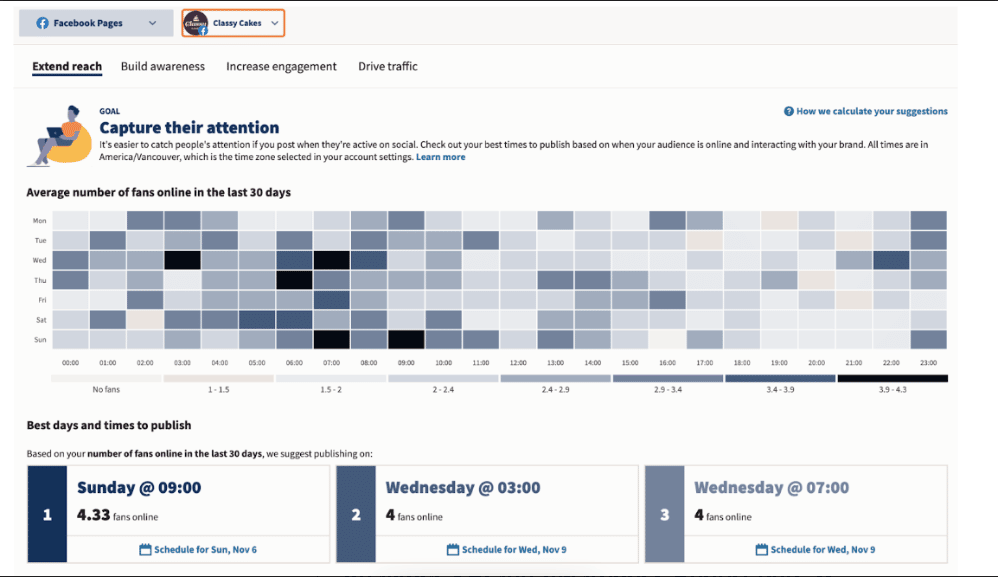
Hootsuite’s Facebook Analytics also show you a heatmap that tells you exactly when your audience is most likely to be online, and provides custom recommendations for the best time to post based on your engagement goals.
Here’s how to find your Facebook analytics in Hootsuite:
- Go to your Hootsuite dashboard and click the Analytics icon in the sidebar.
- Select your Facebook Overview (if you haven’t already, follow these steps to connect your account). On this screen, you’ll see a full picture of all your Facebook analytics, from engagement to link clicks to the sentiment of your inbound messages. There are also plenty of pre-built Facebook report templates for you to dive into more detail.
- Use the buttons in the top navigation bar to share data with your colleagues or export the metrics and charts into a custom report in PDF, PowerPoint, Excel, or .csv.
Growth = hacked.
Schedule posts, talk to customers, and track your performance in one place. Grow your business faster with Hootsuite.
Important Facebook analytics metrics
Now that you know where to find your Facebook analytics data, let’s look at some of the most important metrics for you to track.
Facebook Page analytics
- Reach: This includes people who saw content posted on your Page as well as people who saw content posted about your Page by other social users.
- Visits: The number of times people visited your Facebook Page.
- New likes: The number of new people who liked your Facebook Page.
- Follower growth rate: How quickly your Page is gaining or losing followers.
- Virality rate: The percentage of times content from your Page was displayed as a result of reactions, comments, and shares (available in Hootsuite Analytics).
Facebook audience insights
- Age & Gender: The breakdown of age groups and percentage of women and men (no statistics for non-binary folx at this time, unfortunately).
- Location: You’ll see the top cities and countries for your audience, so you can understand just where the likes and followers are coming from.
Facebook post analytics

- Post reach: The Content Overview screen indicates the number of people who saw at least one of your posts at least once. This is an overall metric, but you can also dive into the reach numbers for each specific post by clicking on the Content item under the Content heading. While the overall metric provides a good sense of trends in your post viewership, the per-post metrics are more useful in terms of understanding what’s actually resonating with your audience.
- Post engagement: The number of reactions, comments, and shares. Again, you can see both the total number for all Page posts and the details for each specific post. For reference, the average Facebook post engagement rate is 0.07%.
Facebook stories analytics
The metrics here are the same as for Facebook posts. You can also scroll down to the bottom of the screen to see your stories with the highest reach, highest sticker taps and most replies. Again, you can see the data for each specific story by clicking on Content under the Content heading.
Facebook Reels analytics
Oddly enough, Facebook considers Reels to be Posts in the Insights interface. To access your Face Reels Insights in Meta Business Manager, go to Insights>Content>Content, then unselect ads and stories in the top drop-down menu.
To make things more (or less?) confusing, within the Posts section of Content Insights, the Type column will identify Reels as Reels.
Source: Meta Business Manager
For each reel, you can track:
- Reach: The number of people who saw your reel at least once.
- Engagement: As for other post types, this is broken down into reactions, comments, and shares. Add them together for the total number of engagements, or track each individual metric based on what matters most to your business.
Facebook ads analytics
Rather than Meta Business Suite, the best native tool for viewing your Facebook ads analytics is Meta Ads Manager. You can also see Facebook ads analytics reports alongside your organic reporting in Hootsuite Analytics.
- Reach: The number of people who saw your ad at least once. This number is important to compare to the actual number of click-throughs or engagement — if they’re seeing it but not following your CTA, what may have gone wrong?
- Impressions: This is the number of times your ad appeared on screen. This number will likely be higher than reach, as the same person might see your ad more than once.
- Cost per result: To measure the ROI of a campaign, this piece of data is key to revealing just how much bang you got for your buck.
Facebook Group analytics
Facebook Groups are an amazing way for brands to build fan communities — and an even better way to collect data on who your most passionate followers are through your group’s Admin Tools. You can only see insights for Groups with 50 or more members.
Bonus: Download a free guide that shows you how to save time and money on your Facebook ads. Find out how to reach the right customers, lower your cost-per-click, and more.
- Top contributors: Reveal who the most-involved members of your community are — and possibly tap them for influencer or partnership opportunities.
- Engagement: Understanding when your members are most active can help brands understand when and what to post for maximum reach.
- Growth: Track how many members are joining your community, and what the catalysts to surges have been. This might give you insight into possible future promotional opportunities.
Facebook Live analytics
You can find Live analytics by clicking on the Live video you’d like to see the metrics for.
- Peak viewers: Track the highest number of simultaneous viewers at any point during your video when it was live.
- Views: The total number of views your Live video has experienced.
- Engagement: Add up the total number of reactions, shares, and comments.
Facebook video analytics
- Video retention: A measure of how many people made it to each point in your video. You can see the average 3-, 15-, and 60-second views. Like other forms of Facebook posts, you can also dive into the specifics for each video to see what’s resonating best with your audience.
- Average view duration: This statistic is helpful for determining just how your content is hitting. After all, if someone is tuning in and immediately leaving without watching the video, how much does their “view” actually matter?
- Video engagement: Compile reactions, comments, and shares for a clear picture of just how engaging your video content is. For reference, the average Facebook video post engagement rate is 0.08%.
So – that’s a lot. Keep in mind that not every metric will be equally important for your business. When you’re first getting started with Facebook analytics, focus on a few key metrics that align with your business goals and social strategy. Over time, you can start tracking more detailed metrics to get a more in-depth picture of your success on Facebook.
FAQs about Facebook analytics
Still have burning questions? We have answers.
How do I check Facebook analytics?
The most basic option is to click See insights and ads under any of your Facebook posts. This gives you a high-level snapshot of the success of that post. For more detailed analytics, reports, graphs, and comparisons, you’ll need to use Meta Business Suite, Facebook Page Insights, or Hootsuite Analytics.
What do Facebook analytics show?
What you see when you check your Facebook analytics depends on which tool you use. Clicking on insights for any individual post from your Facebook page brings up a pop-up with quick stats for impressions, reach and engagement.
Facebook analytics tools can provide much more information than that, from your overall Page metrics to comparing the success of your Facebook efforts to those on other platforms.
Does Facebook Insights still exist?
Facebook Insights does still exist, but it’s now accessible directly from your Facebook Page itself or from the Professional dashboard. So, Facebook Insights no longer exists as a standalone tool, but the information is still available.
Use Hootsuite to schedule all of your social media posts, engage with your followers, and track the success of your efforts. Sign up today.
All your social media analytics in one place. Use Hootsuite to see what’s working and where to improve performance.
The post 3 Tools to Use Instead of Facebook Analytics [2023 Edition] appeared first on Social Media Marketing & Management Dashboard.


Recent Comments