
Creating a social media report may not be the most exciting part of a social media manager’s job. But it is certainly an important one.
In social media marketing, anything worth doing is worth reporting on. After all, tracking and analyzing your performance is the only way to really understand what you’re accomplishing through your social efforts.
It’s also the only way to demonstrate the value of your social marketing efforts to your team and your boss. From staff morale to increased budgets to growing your team, it’s critical to have data that shows the importance of your work to the organization.
When things are not going so great, social media reporting is equally valuable, as it can help you learn from your missteps and get things back on track.
Bonus: Get a free social media report template to easily and effectively present your social media performance to key stakeholders.
What is a social media report?
A social media report is an internal reporting document that presents and tracks relevant data about your social media activities.
It can be anything from a simple list of numbers in a spreadsheet to a spiffy slide presentation packed with analysis. It all depends on the purpose of your report and who your audience will be.
You might need multiple reports to suit different audiences or goals.
What should your social media report include?
The short answer is that your social media marketing report should include the data and analysis your audience needs to understand your social media performance — no more, no less. That audience might be your boss, your team, or even yourself.
Of course, your team needs a much more granular report than your boss does. And you probably want an even more detailed one for your own records.
Your social media report should also look nice and be easy to follow. There’s no need to go overboard with the formatting or include unnecessary details. It’s best to let your data tell the story.
Here is a suggested structure to get you started. To make things easy for you, we’ve also included a free social media report template, which you can download below.
Feel free to mix and match the sections to create a custom social media reporting tool that works for your intended audience and reporting needs.
An outline of your social media marketing strategy
Start your social media report with a quick overview of your social media strategy. This provides context so your readers understand what to expect in the rest of the report.
You’ll go into more detail in the next sections, but this is the place to lay out the overarching purpose of your social activities as they relate to business strategy.
Does your company use social primarily as a channel for customer service? Social commerce? Brand awareness? All of the above?
Be sure to highlight any changes in strategy since the last time you reported, including any new channels you’ve incorporated into your social mix.
Goals
Now it’s time to get more specific. Take the guiding strategy you highlighted in the first section and break it down into clear, measurable goals. It’s a good idea to use the SMART goal-setting framework, since it ensures you create goals that are straightforward to track and report.
The number of goals you include will vary depending on how well established your social strategy is and the size of your team. If this is your first social media report, stick to just a few goals. Once you’ve established a pattern of tracking, learning, and success, you can add more goals over time.
Success metrics
Now it’s time to think about what data you’ll report to validate your goals. SMART goals have success metrics built right into them.
For example, if your goal is to increase the number of leads generated by 25 percent in Q3, then you’ll need to report on the number of leads generated. The metrics that matter will be different for every team, but some key overall metrics to include for your social program are:
- Number of leads generated
- Number of conversions
- Total revenue generated
- Total return on investment (ROI)
- Total spend (on social ads)
- Social share of voice
- Social sentiment
If you’re using social media for customer service, it’s also a good idea to report on service metrics like net promoter score (NPS), customer satisfaction score (CSAT), and resolution time.
Of course, you can include much more data if it’s relevant to your objectives. For a full breakdown of all the numbers you might want to include in your social media business report, check out our post on social media metrics that really matter.
Results per network
Drilling down even further, this section provides specific results for each social network. If it makes sense for your team, you can get even more specific and break things down by format within a network, such as Stories vs. posts vs. Reels.
The specific data to include in this section will depend on the goals and success metrics you’re included above. Here are some of the most common numbers to include for each social network:
- Number of posts
- Net followers gain or loss
- Engagement rate
- Click-through rate
- Top-performing post(s)
No matter what metrics you choose, provide some previous results for context. After all, data means nothing in a vacuum. If you’re reporting on a campaign, look for a similar past campaign to compare what you achieved.
If you’re creating a regular weekly or monthly report, track your results compared to the previous several weeks or months. This allows you to see ongoing trends. You could also compare your results to the same period from the previous year, to account for any seasonal trends.
Wins
Having presented your data, it’s time to dive into the analysis. First up, highlight anything that went specifically well during this reporting period.
Look beyond the numbers here. Maybe you made contact with a key social media influencer for the first time. Or maybe a particularly compelling review came in through social that you’ll be able to use in future marketing campaigns.
Include room in your social media report to share all forms of success that are relevant to your goals.
If you can, try to determine why you got the results you did. The facts are interesting, sure, but the reasons behind the data are what can help you tweak your strategy and set meaningful social media goals.
Opportunities
This section offers the chance for some soul-searching and recalibration. Was there anything that went a little sideways this period? If so, can you pinpoint why? And what’s your plan to get back on track?
Bonus: Get a free social media report template to easily and effectively present your social media performance to key stakeholders.
This is also a good section to report on new opportunities in the market you’ve uncovered through social listening or interaction with your followers. Is there a type of content followers want more of? Has your social care team flagged an ongoing issue that could be resolved through better documentation or an FAQ?
Summary
End your report by summarizing what you achieved and what you learned. Focus on the big takeaways and how they will help guide your future strategy.
How to create a social media report in 5 steps
Step 1: Determine your audience
Is this report meant for your boss, your marketing team, or VPs? Or maybe it’s just for you?
Focus on what’s important to each audience, instead of forcing everyone to dig through a general report to find what’s relevant to their jobs. The higher up you go in your company, the more concise and focused your report needs to be.
Step 2: Focus your reporting
Social media can help drive awareness, sales, leads, engagement—the list goes on.
Make sure to stay laser-focused on the social media KPIs and metrics that matter most to your business — and the stakeholders you’re reporting to. Don’t get bogged down by reporting on additional stats unless you notice a major spike or something noteworthy.
Step 3: Gather your data
Social data comes from a lot of sources. We’ll get into the specifics of where to find the data you need later in this post.
Step 4: Analyze your data
Raw data doesn’t mean a whole lot. Following the sections outlined above, crunch the numbers to look for trends, anomalies, and any other patterns that provide a picture of what’s working and what’s not.
Step 5: Present your findings
All of this information needs to go into a document that’s clear, concise, and easy to understand. That document is your social media report. On that note, now’s a good time to look at our social media report template.
Social media report template
We’ve created a social media report example template you can use to make sure your report looks good and hits all the most important areas of data and analysis.
Bonus: Get a free social media report template to easily and effectively present your social media performance to key stakeholders.
Once you download our free template, follow the instructions to customize it.
If you’d prefer to create your own social media report template, you have a couple of options.
If you’re going to focus primarily on numbers, you can create a template in Excel or Google Sheets. For reports with more analysis, use a spreadsheet to gather your data, then present it in a Google Doc or slide presentation.
Another great option is to use a social media reporting tool like Hootsuite Analytics to build custom reports. You’ll then have access to easy-to-read charts and graphics you can export directly to a spreadsheet, PDF or PowerPoint.
Social media reporting tools
Now that you know what data to include in your social media report, here’s where to find it on the main social media platforms.
Meta Business Suite
While you can access Instagram and Facebook Insights individually on each platform, Meta Business Suite is a more robust reporting tool that offers data for both platforms side-by side.
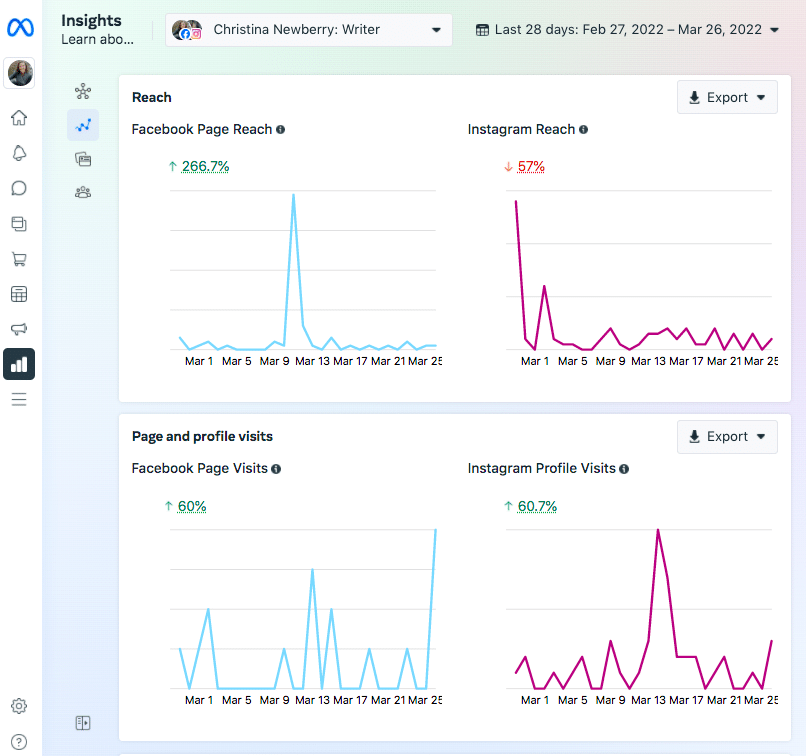
To access insights in Meta Business Suite, head to http://business.facebook.com and click Insights in the left menu. We’ve got a dedicated blog post about how to use Meta Business Suite if you’re looking for in-depth details.
To export data for your social media report, click Export Data on the top right of any chart. You can choose which data to export and the format that works best for you (.png, .csv, or .pdf).
Twitter Analytics
Open your Twitter profile and click on the three dots icon in the menu, then click Analytics.
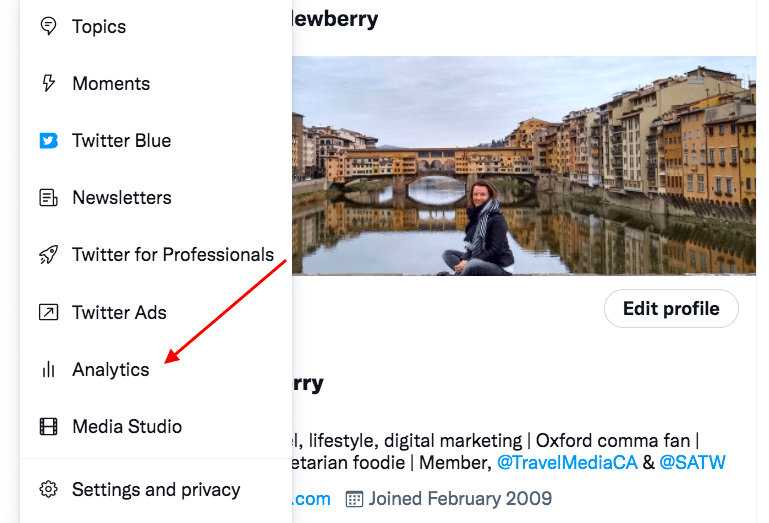
You’ll find key data on the main analytics screen.
To find more detailed information, click through the options in the top menu of your Twitter Analytics screen. From there, click Export Data to export the information as a .csv file so you can add it to your social media report.

LinkedIn Analytics
Open your company page and click Analytics in the top menu, then choose Visitors, Updates, Followers, Competitors, or Employee Advocacy.
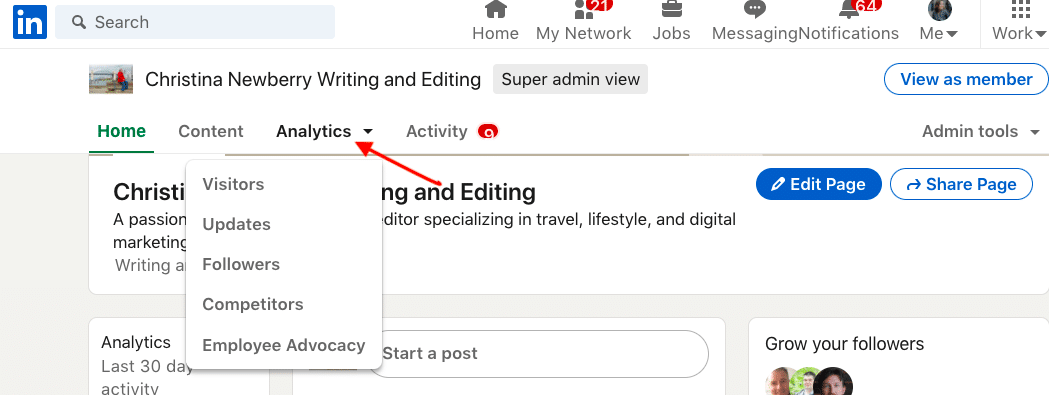
You’ll get access to metrics like page views, impressions, and engagement rate.
LinkedIn Analytics offers an interesting feature to consider for your social media reporting. If you choose the Competitor Analytics page, you can see how you compare to up to nine other pages.
To export your data as an .xls or .csv file (depending on which data you’re downloading), click the blue Export button on the top right.
TikTok Analytics
To access TikTok Analytics, you’ll need a TikTok Business or Creator account. Once you’ve made the switch, head to your profile. Tap the three dots, then Business Profile (or Creator Profile), and then Analytics.

Source: TikTok
This gives you good information about how you’re doing on TikTok. However, if you want to export the data into your social media report, you’ll need to access TikTok Analytics on desktop.
Log in on your computer, hover your cursor over your profile photo and click View Analytics. You can access overall metrics for your account, as well as detailed info about each of the videos you’ve uploaded.
Hootsuite Analytics
Hootsuite Analytics allows you to collect data and create reports for multiple Facebook, Twitter, Instagram, and LinkedIn profiles from one dashboard.
You can customize the dashboard to track the metrics that you’ve identified as most important for your social media report, including team and time metrics.
When it’s time to create your report and share your data, you can customize what information to include. You’ll have access to a great selection of charts that tell your reporting story in a highly visual way, so the information is easy to consume at a glance.
You can share reports with team members directly within the Hootsuite Analytics interface. Or, you can download your complete social media report as a PDF, a PowerPoint, or a spreadsheet file that’s ready to share.
To get more details on how to make the most of the data available through all of these social reporting tools, check out our blog post dedicated to social media analytics.
Use Hootsuite to do all your social media reporting from a single dashboard. Choose what to track, get compelling visuals, and easily share reports with stakeholders. Try it free today.
All your social media analytics in one place. Use Hootsuite to see what’s working and where to improve performance.
The post How to Create a Social Media Report: 2022 Edition (Free Template) appeared first on Social Media Marketing & Management Dashboard.


Recent Comments