If you expected digital to return to “business as usual” in 2022, you may want to reset those expectations.
Our new Digital 2022 Global Overview Report—published in partnership with Hootsuite and We Are Social—reveals that most of the connected world continues to grow faster than it did before the pandemic.
Social network user numbers. Time spent on those platforms. Social ad spend. They’re all growing. Read on for the juicy details.
Download the complete Digital 2022 report—which includes online behavior data from 220 countries—to learn where to focus your social marketing efforts and how to better target your audience.
Top 10 takeaways
This video offers a handy summary of this year’s essential headlines and trends.
Social media users grew 10% in last year
Meanwhile, social media users have seen even faster growth than internet users over the past decade.
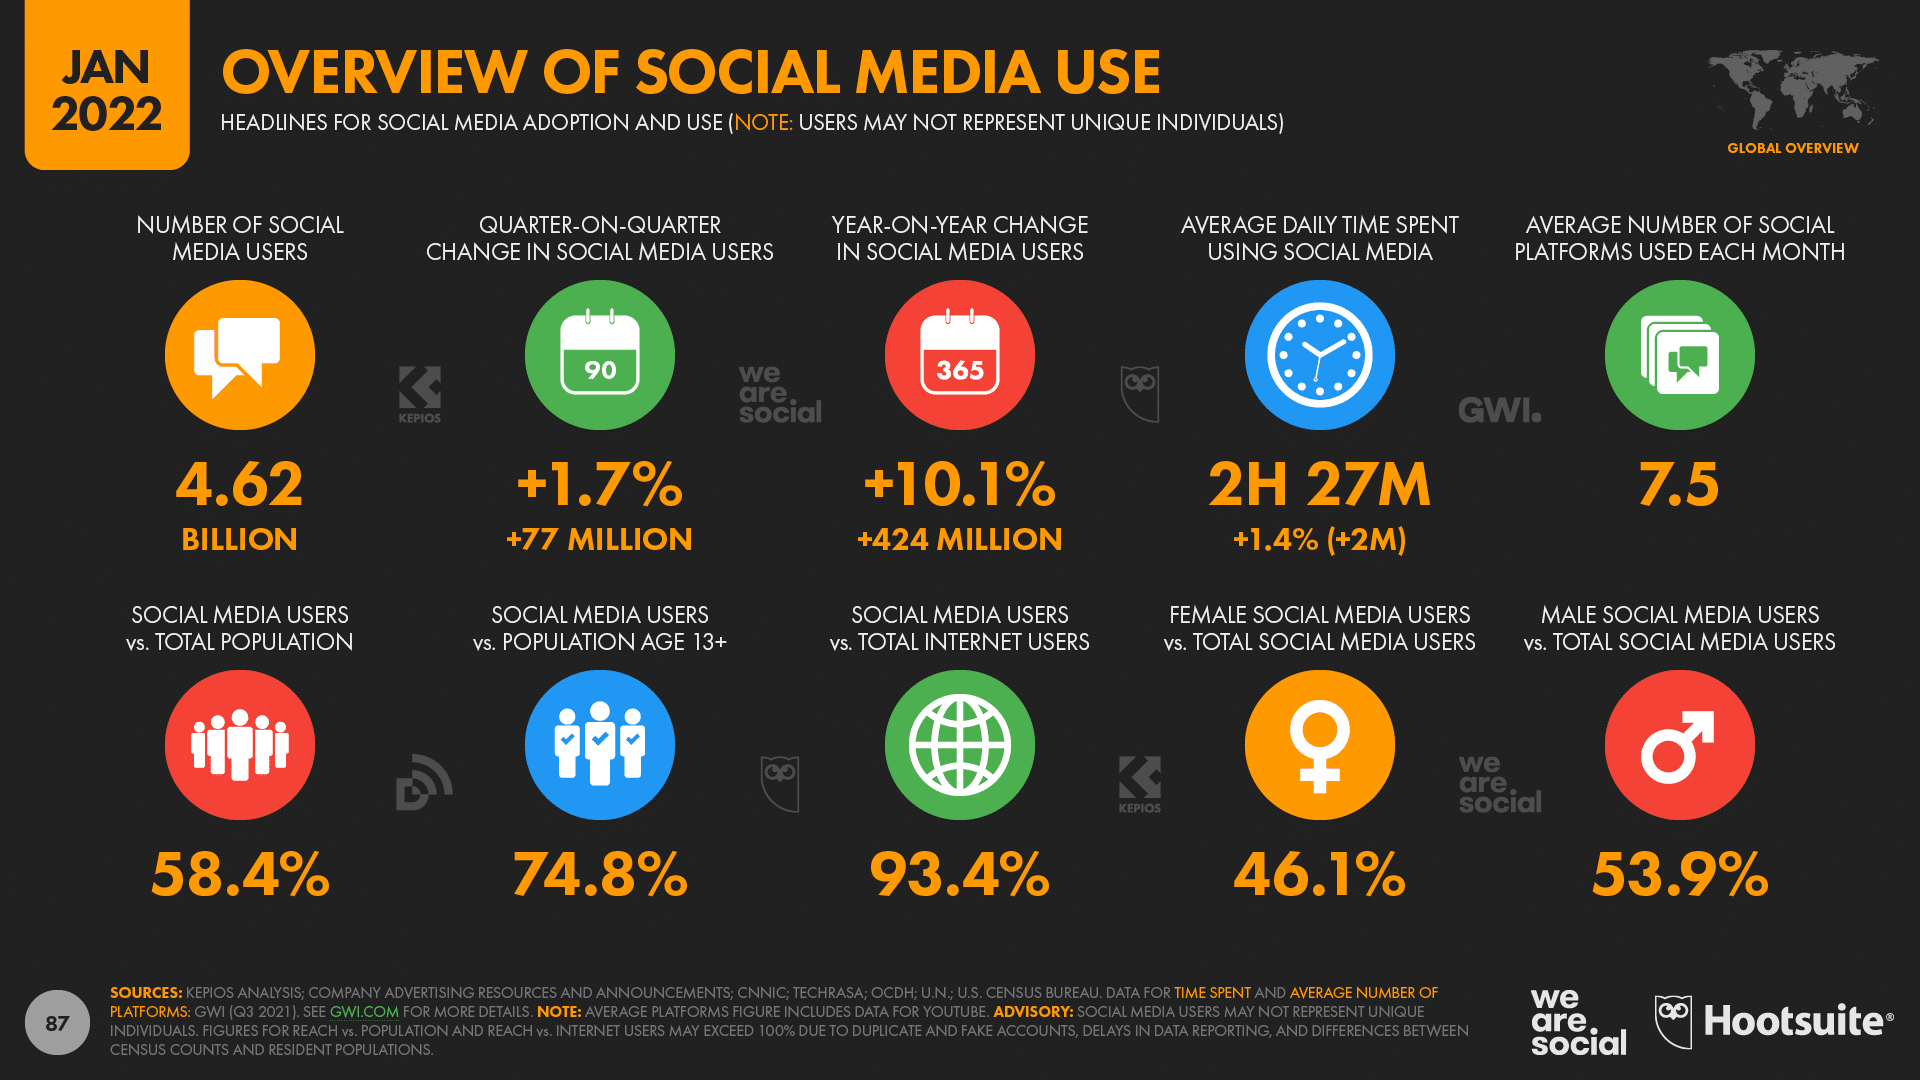
Today’s total of 4.62 billion social media users is 3.1x higher than the 1.48 billion figure we published in 2012, and means that social media users have grown at a compound annual growth rate of 12% over the past decade.
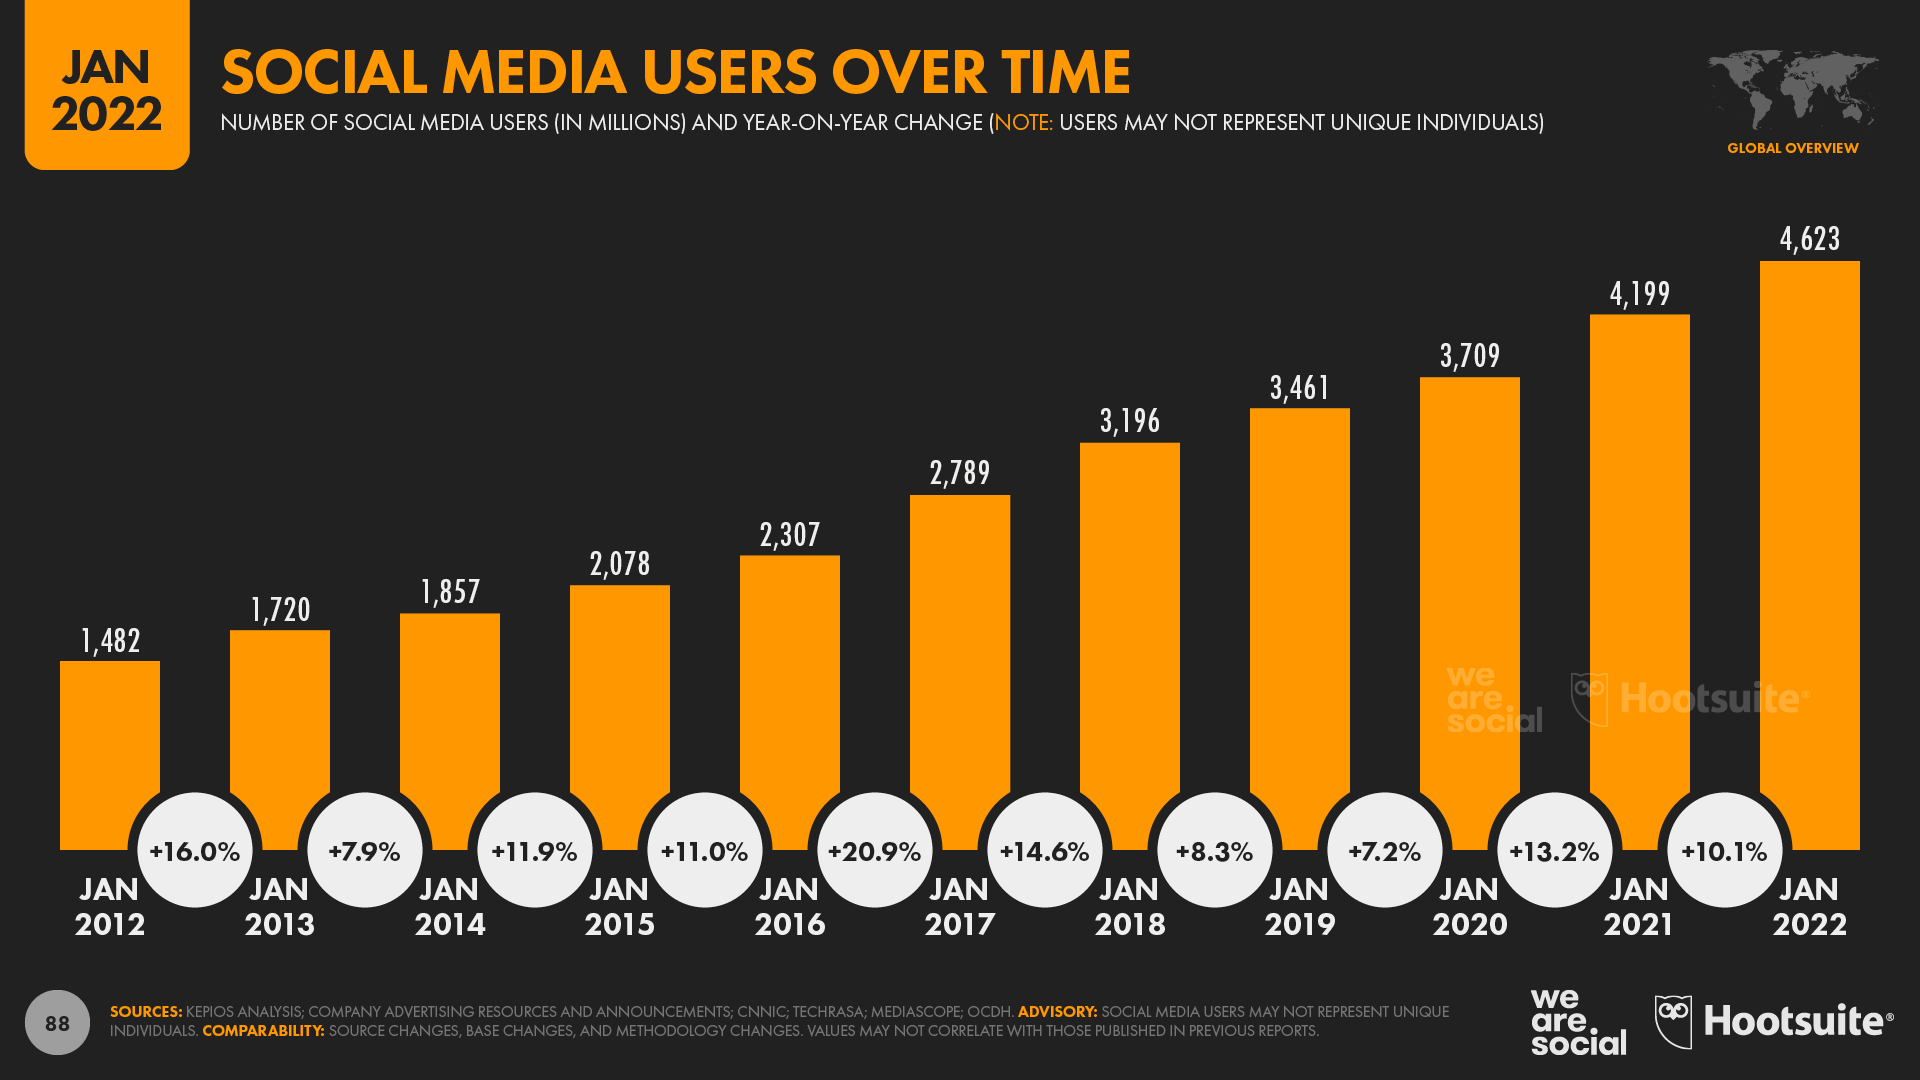
Social media user growth has continued at a double-digit rate of 10.1% over the past 12 months too, but I confess I’m surprised that the growth rate between 2021 and 2022 has remained above pre-pandemic levels.
For context, the latest data indicate that 424 million users started their social media journey over the past year, equating to an average of more than 1 million new users per day, or roughly 13.5 new users every single second.
However, anyone who had been wavering about joining social media before the pandemic struck would have been most likely to join during the early days of lockdown in 2020, so I’m hesitant to attribute any meaningful share of growth over the most recent 12 months to some kind of “COVID effect”.
Moreover, with social media users now equating to 58.4% of the world’s total population, we should expect to see growth rates start to decelerate over the next few years, and this may well be the last time that we report double-digit annual growth in social media users.
The good news is that we should see social media users reach the equivalent of 60% of the global population sometime in 2022 though, so even if growth rates do subside, the overall reach potential of social media should still offer plenty to get excited about.
Social users have a new 2nd favorite
When it comes to the world’s “favorite” social media platforms, GWI’s latest data reveals that Instagram has now overtaken Facebook to claim second place in the worldwide rankings.
It’s still a close call though: 14.8% of global internet users identify Instagram as their favorite platform, compared with 14.5% for Facebook.
However, yet another Meta platform, WhatsApp, tops the global rankings, with 15.7% of working-age internet users choosing the messenger app as their favorite social platform.
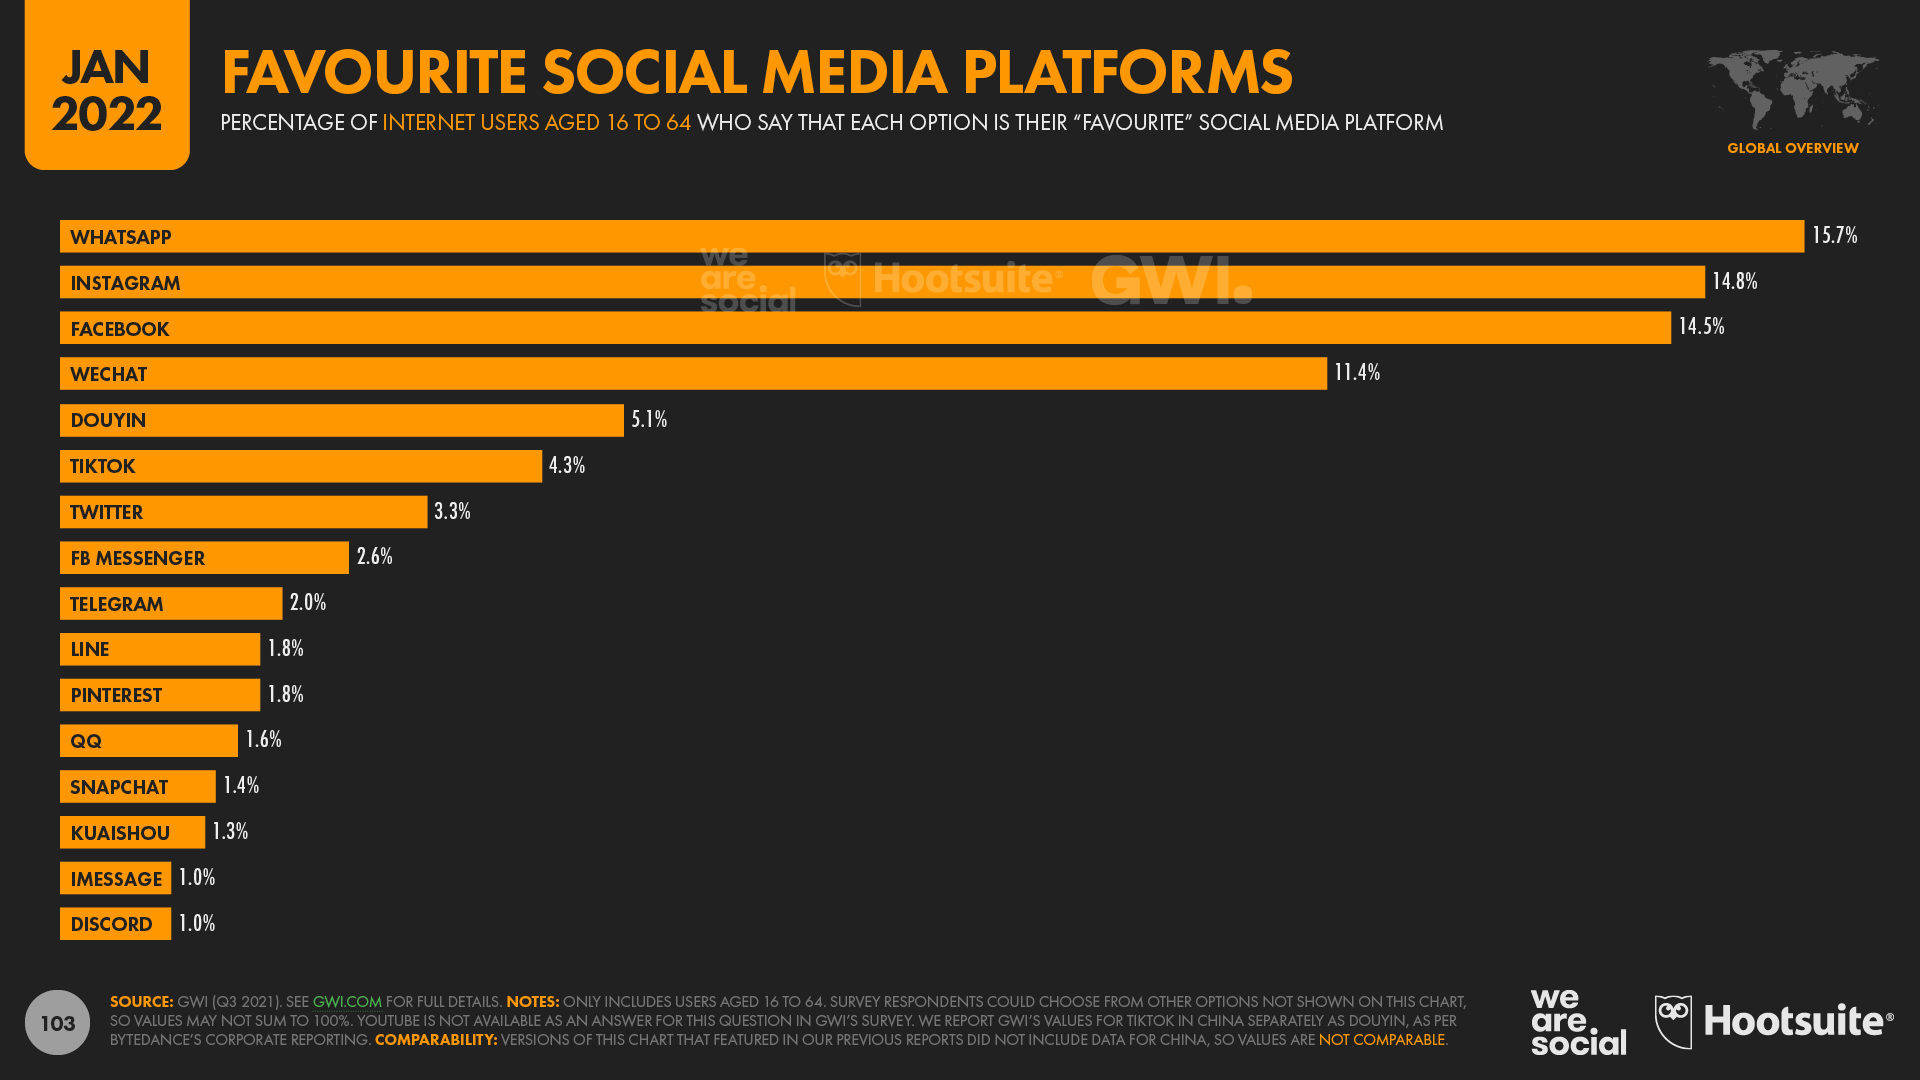
Interestingly, WeChat gains enough votes to rank fourth at a global level, despite a whopping 99% of the platform’s votes coming from users within Mainland China.
China is home to roughly 20% of the world’s total internet users though, so it’s perhaps unsurprising that the country’s social media users have such a big impact on these global rankings.
However, you may be more surprised to see TikTok sitting at just 4.3% of the total vote.
That doesn’t quite match the excitement TikTok generates in the media, but it’s worth noting that the number of people choosing TikTok as their favorite social platform has jumped by 71% in the past 90 days, and TikTok’s overall share of the vote has increased by 180 basis points in just three months.
Furthermore, App Annie reports that TikTok was the most-downloaded mobile app in 2021, and the platform continues to enjoy strong growth in ad reach too (more on that later).
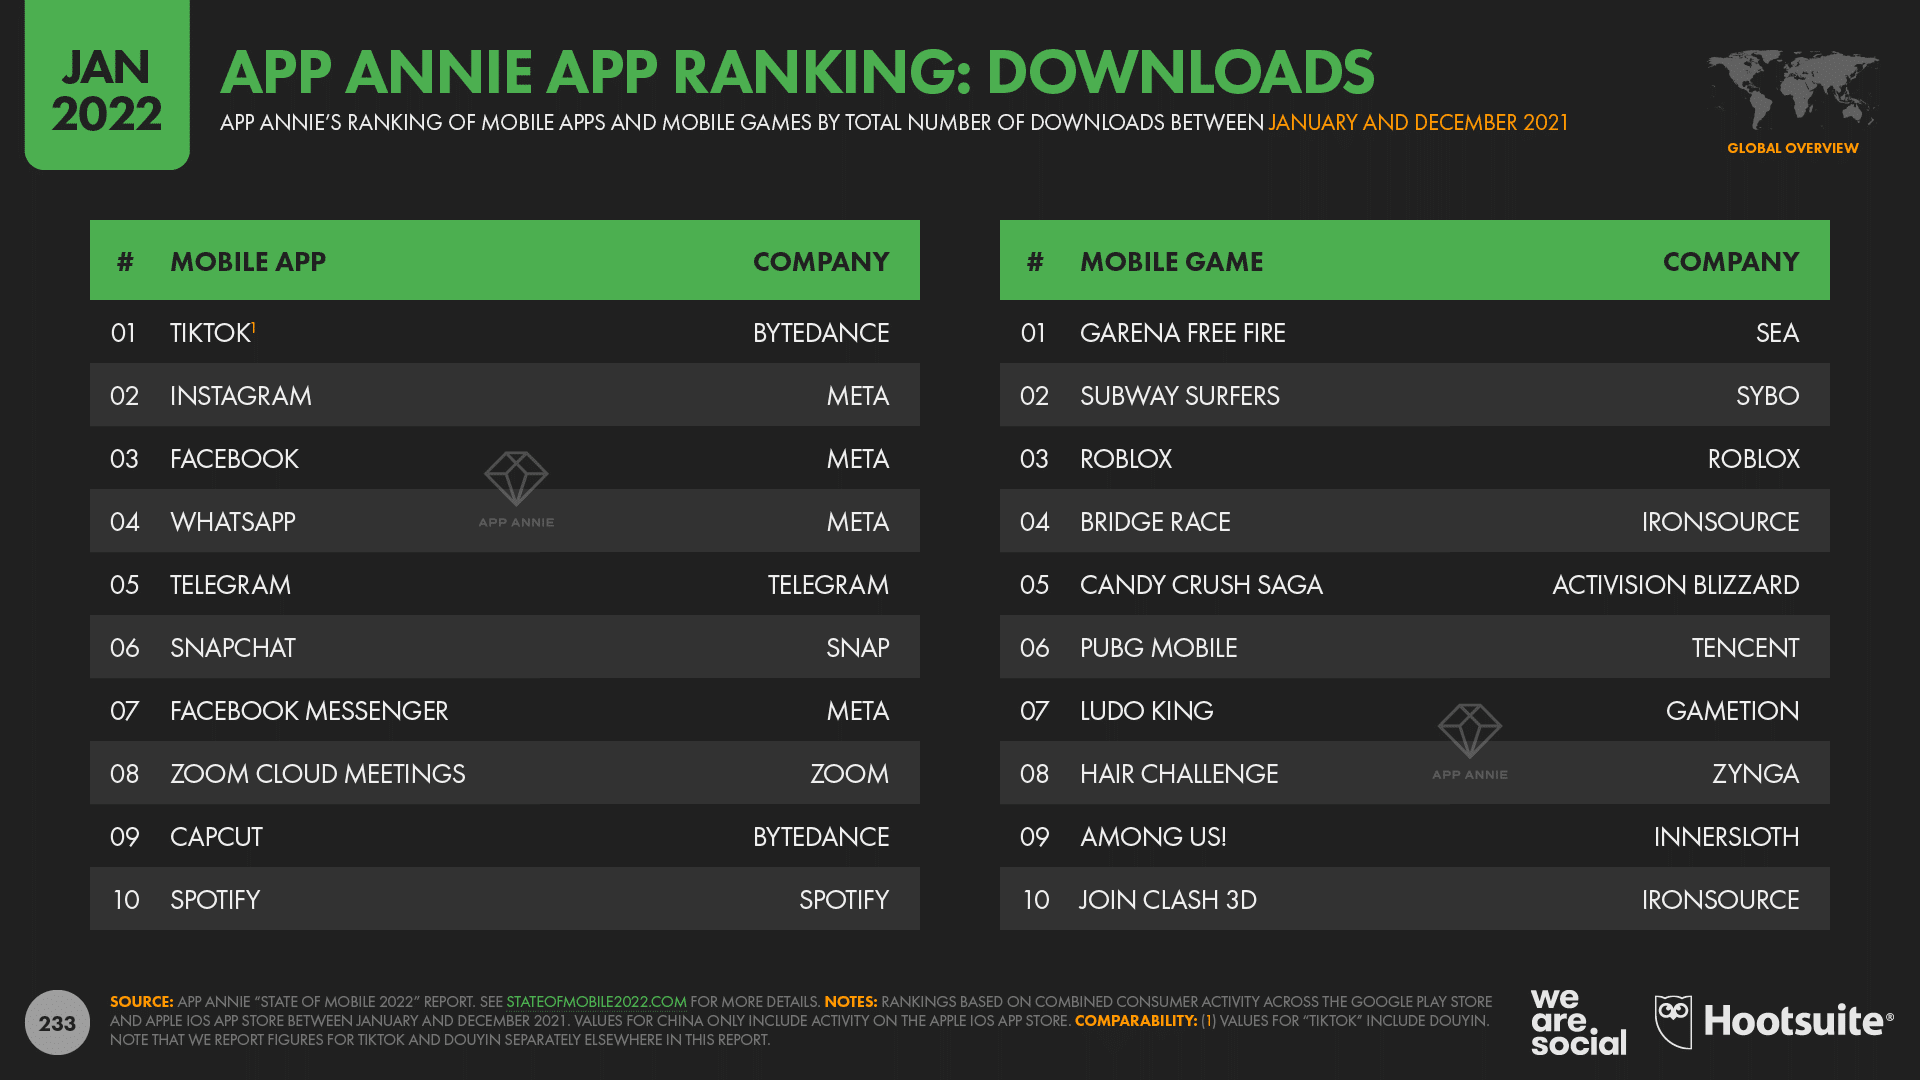
As a result, we expect to see TikTok make even bigger gains in these rankings over the coming months, so be sure to come back to see our quarterly Statshot reports in 2022 to keep track of its progress.
Time spent on social continues to rise
One of the top stories at the start of the COVID-19 pandemic was how much more the world came to depend on the internet, especially as countries entered lockdown.
However, despite fluctuations in movement restrictions over the past two years, the latest data show that people are in fact spending more time than ever using connected tech.
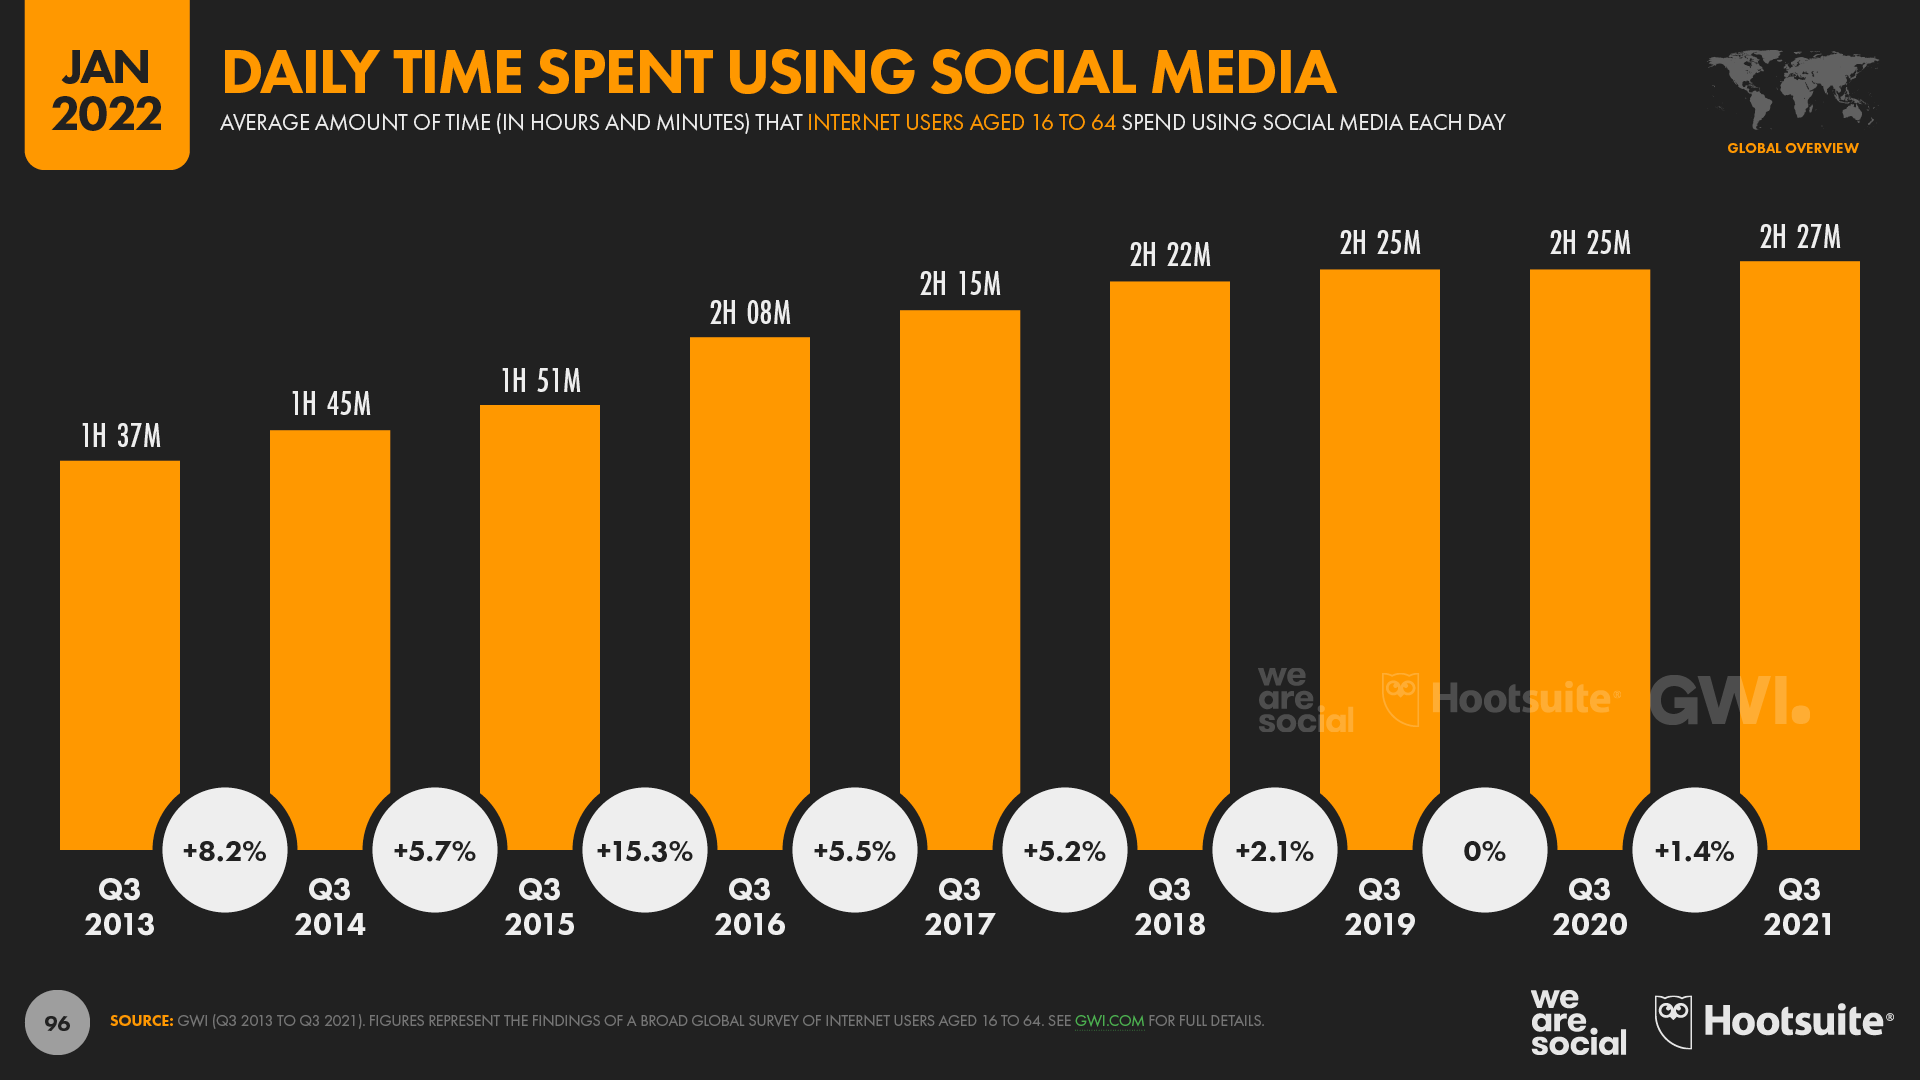
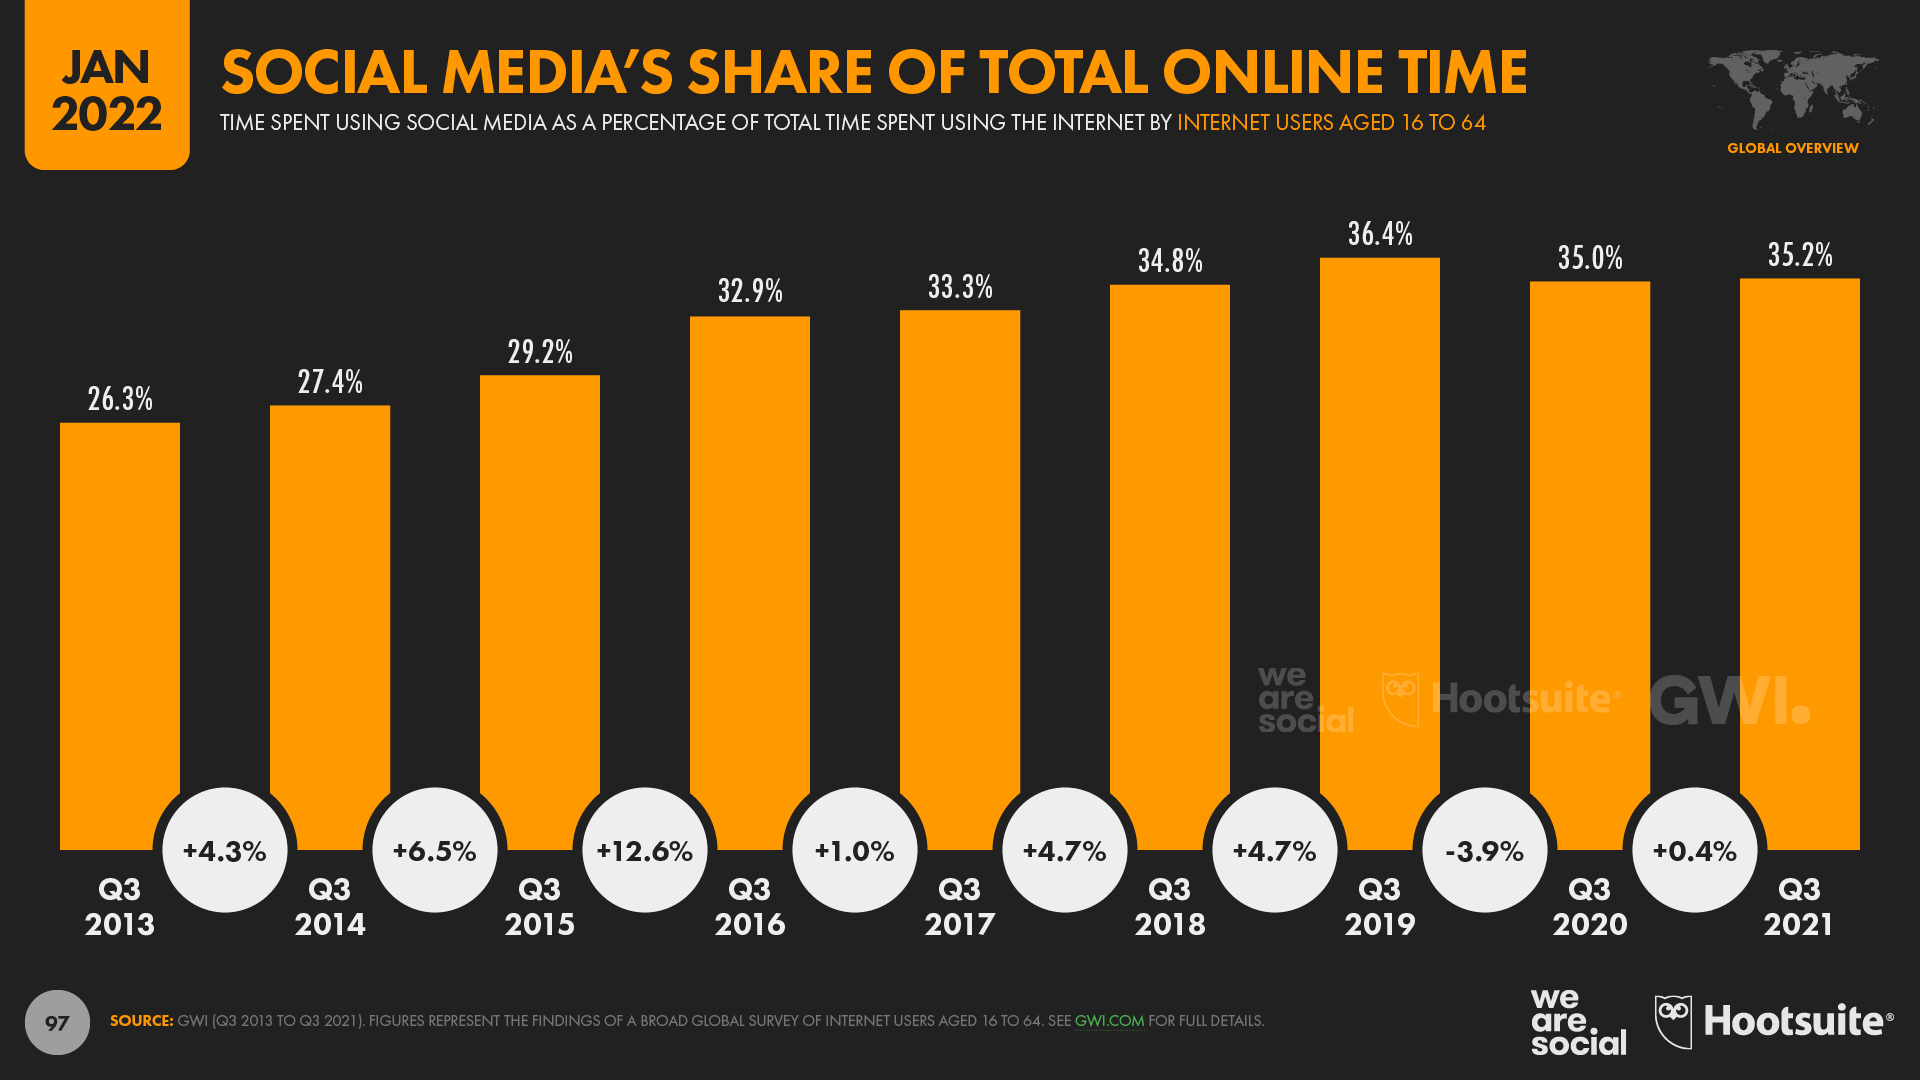
At an average of 2 hours and 27 minutes per day, social media accounts for the largest single share of our connected media time, at 35% of the total.
The time we spend using social media has grown again over the past year too, up by 2 minutes per day (+1.4%).
However, social media’s share of overall internet time has actually fallen slightly since the start of the COVID-19 pandemic.
Our analysis suggests that this is largely because people have embraced a variety of new online activities over the past two years, so, relatively, social media now accounts for a smaller share of total online time than it did when people did fewer things online.
However, with the world set to spend more than 4 trillion hours using social media in 2022, there’s little doubt that social media still plays a central role in our everyday lives.
Social users spend the most time on YouTube
But how does that social media time break down by platform?
Well, the good news is that the wonderful folks at App Annie have shared some great data with us this year that reveals how much time people spend using the Android apps of several top social platforms.
For context, handsets running Android account for roughly seven in 10 smartphones in use around the world today, so—while these figures may not include all social media users—they still provide rich insights into how the world actually uses social media platforms.
Overall, App Annie’s data shows that YouTube accounts for the greatest total time spent using social media apps on Android phones, and it also clocks the highest average time per user.
App Annie’s research indicates that the typical YouTube user now spends almost a full day, 23.7 hours, per month using YouTube’s mobile app, but remember that the platform likely also sees meaningful activity on its website, as well as via embeds on third-party websites.

Facebook comes second in terms of total, cumulative time spent using social media apps, with Android users averaging 19.6 hours in the platform’s app each month.
TikTok users also clock in an average of 19.6 hours per month using the TikTok Android app, but because the platform has fewer overall users, TikTok only comes fifth in these rankings by cumulative time spent across all users.
WhatsApp comes third in terms of total time spent, with users spending an average of 18.6 hours per month using the messenger app on Android phones.
Instagram ranks fourth, but users spend considerably less time using the app each month compared with the rest of the top five, at just 11.2 hours per month.
At 11.6 hours per month, LINE also sees impressive average use rates, but with considerably fewer users overall, it only places ninth in the global rankings by total time spent.
For context, average monthly time per user has remained relatively stable across Facebook, YouTube, and WhatsApp over the past year.
Meanwhile, the time spent using Instagram has increased by 10% year on year, equating to almost one additional hour of use per month.
However, TikTok has seen the biggest gains across the top five over the past 12 months.
TikTok’s users now clock in an extra 6 hours and 20 minutes per month using the platform’s Android app compared with this time last year, equating to a year-on-year increase of 48%.
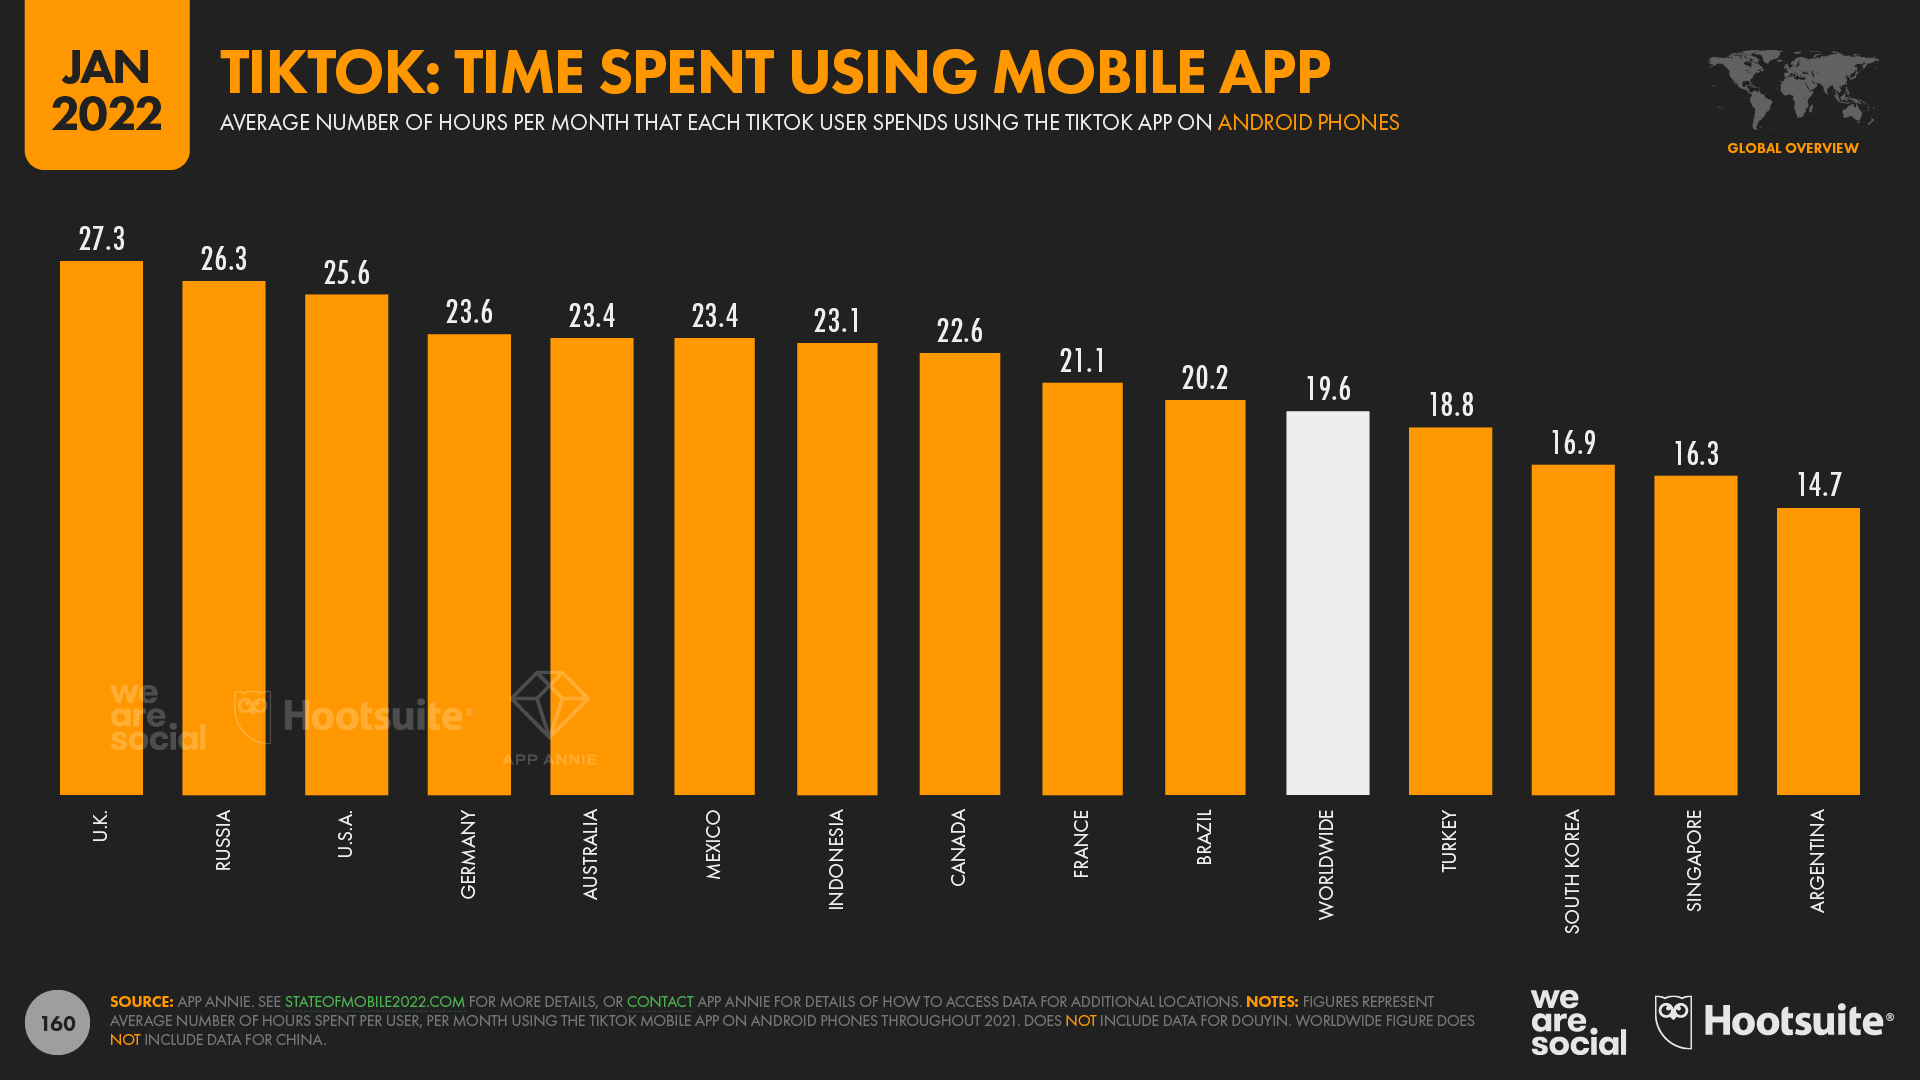
It’s important to stress that these figures vary considerably by geography though, and local rankings can look quite different to this global picture.
Facebook still the most-used social platform
Insights into people’s “favorite” platforms and the time they spend using each one are perhaps the most representative data points for marketers preparing a social media plan.
However, active user numbers still provide valuable benchmarks, especially when it comes to understanding a platform’s momentum.
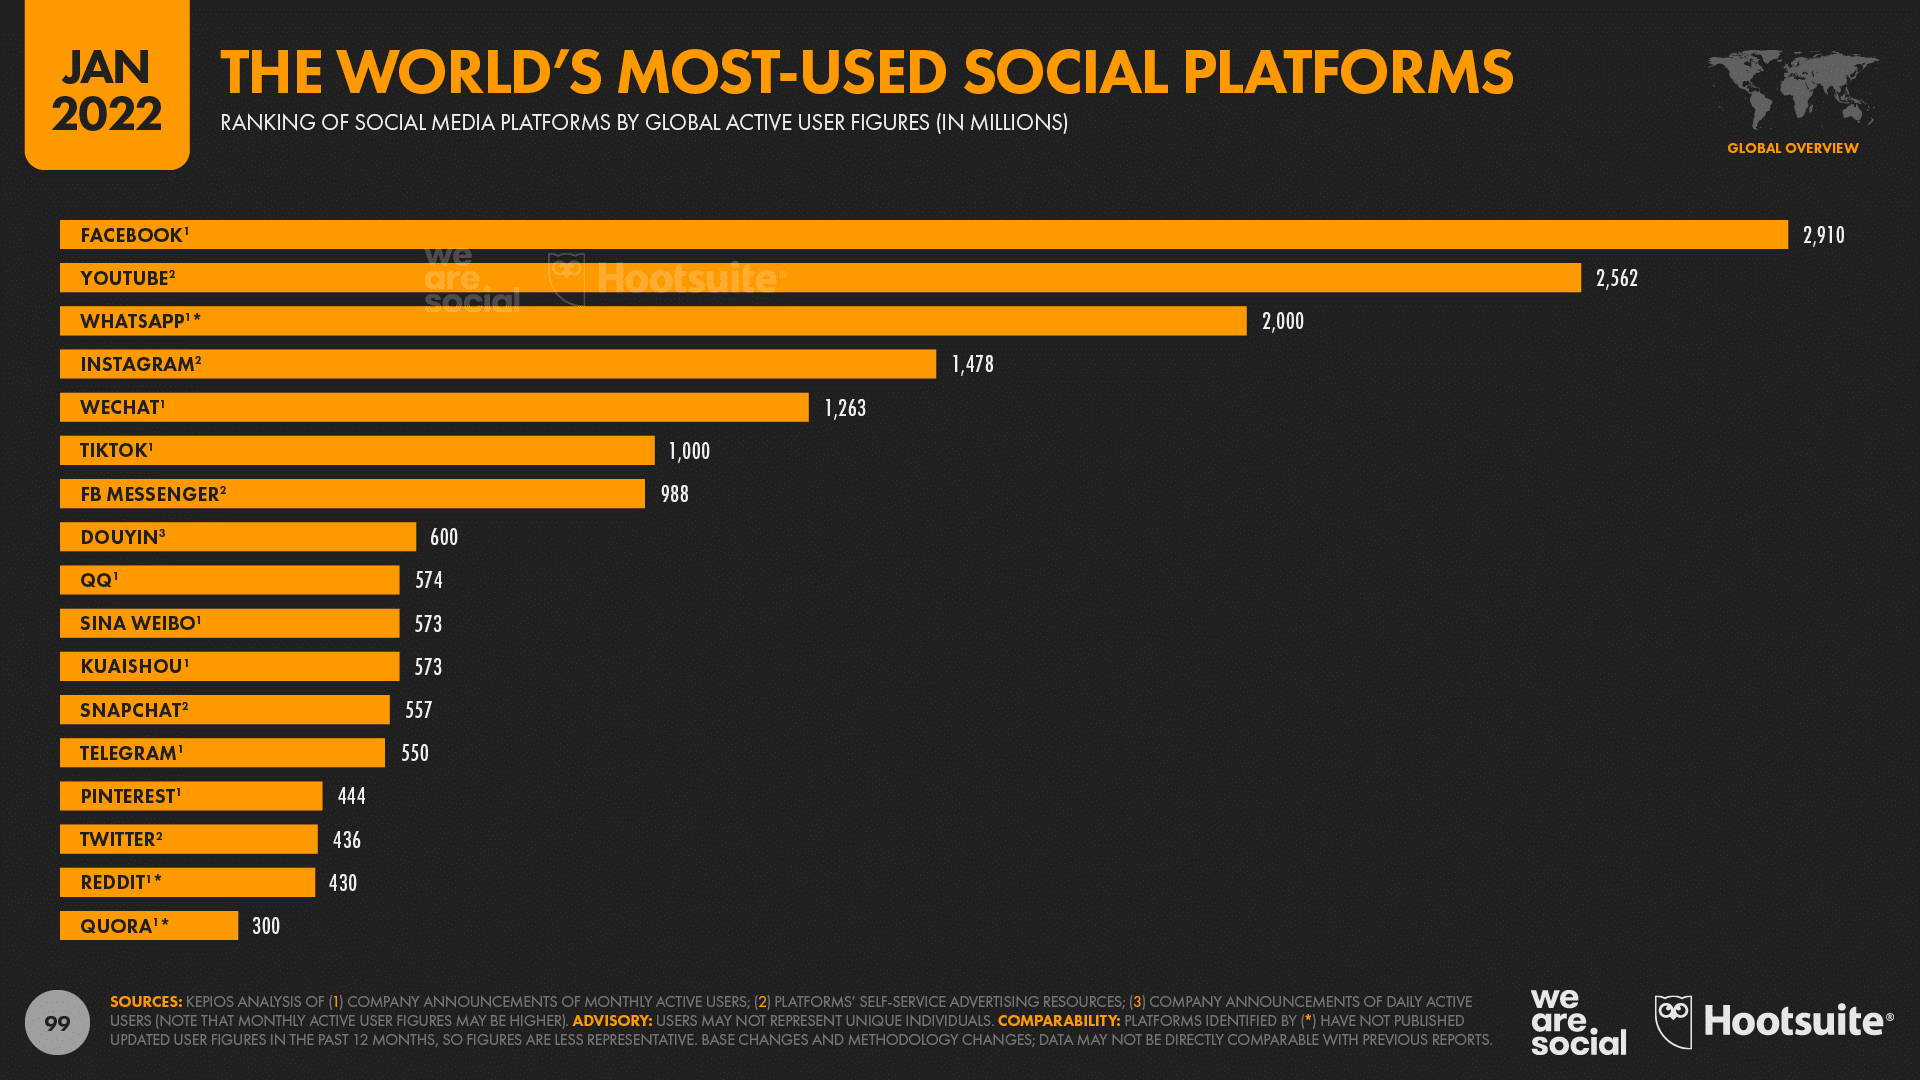
Data published in Meta’s Q3 2021 investor earnings announcement confirms that Facebook is still the world’s most-used social media platform, with 2.91 billion users as of October 2021 (the latest “official” figure at the time of writing).
Facebook’s monthly active user base grew by a solid 6.2% (+170 million users) over the past year, despite already reaching more than half of its total potential audience by age and accessibility. [Note that Facebook is still blocked in China.]
YouTube has closed the gap with Facebook over the past year though, with the platform’s audience growing almost twice as fast as Facebook’s.
YouTube now has at least 2.56 billion active users, which equates to roughly 88% of the latest Facebook total.
However, note that the figures we publish for YouTube are based on the platform’s ad audience, whereas the figures for Facebook represent total monthly active users.
Meta hasn’t published any official updates to global WhatsApp user numbers in the past year, but it’s likely that the platform still ranks third, with at least 2 billion active users per month.
Instagram ranks fourth at a global level, and has seen some of the fastest growth of any platform in the past year (you’ll find more detailed analysis of Instagram’s growth later in this article).
WeChat closes out the top five, with China’s favorite social media platform now claiming 1.26 billion monthly active users.
However, all eyes will doubtless be on TikTok, which currently sits in sixth place in these active user rankings.
Bytedance announced that the platform had passed 1 billion monthly active users back in September 2021, but the company has been characteristically tight-lipped since then, so that figure remains the latest “official” number.
However, it’s worth noting that TikTok’s active user base roughly doubled between December 2019 and September 2021, and with the platform still claiming top spot in the global app download charts, it’s almost certain that TikTok’s monthly active users continue to grow (more on that below).
Meanwhile, Meta hasn’t published an “official” monthly active user (MAU) number for Messenger since September 2017, so we’ve decided to use the platform’s latest ad audience reach figure in these rankings, instead of that older number.
Note that LinkedIn doesn’t publish active user numbers, which is why we’re unable to include it in this list.
Instagram keeps growing and growing and growing
The latest data published in Meta’s advertising resources shows that Instagram’s ad reach has jumped by an impressive 21% over the past year, despite important changes in how the company reports its ad audience numbers.
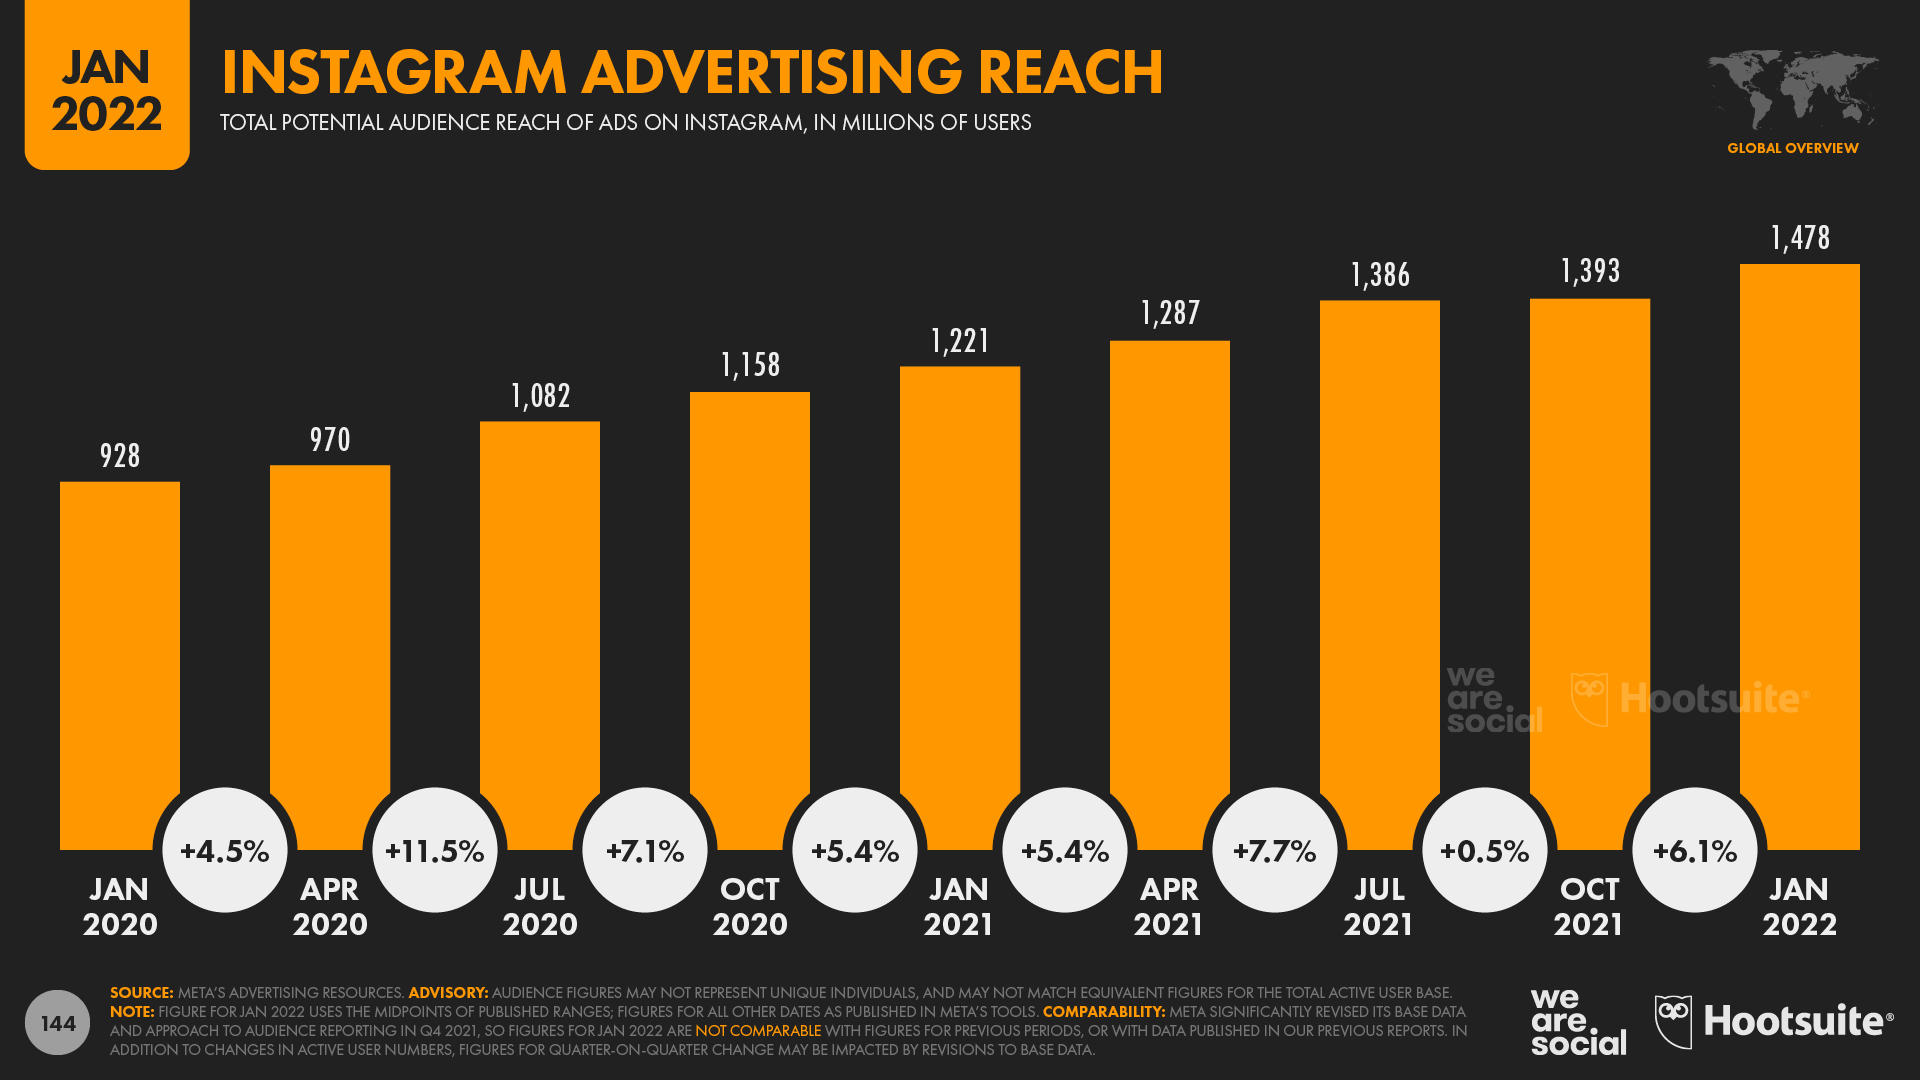
Meta’s own data suggests that more than a quarter of a billion new users joined Instagram during 2021, pushing the platform’s global ad reach to almost 1.5 billion users by the start of 2022.
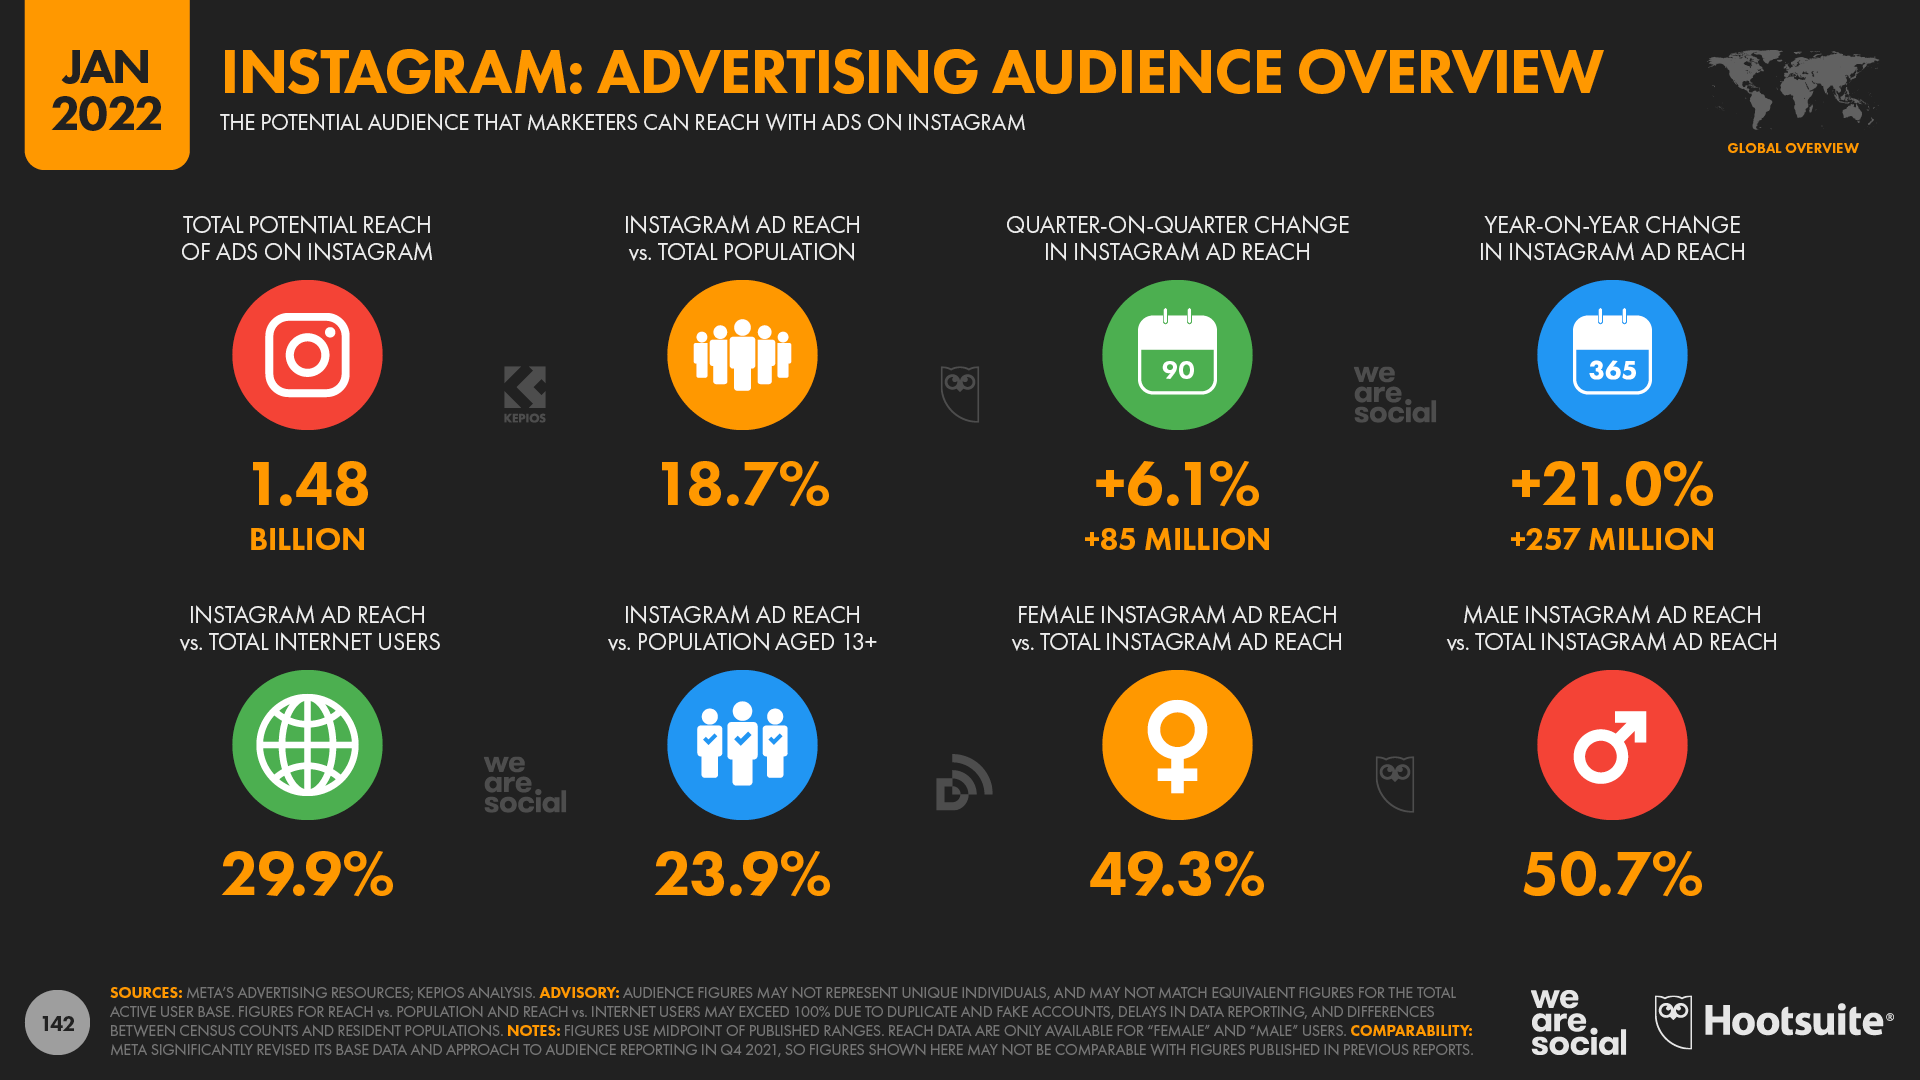
What’s more, Instagram’s audience grew by more than 6% (+85 million users) in just the past 90 days, which suggests that its growth rates continue to accelerate
Instagram has been posting impressive quarterly growth rates for some time now, and our analysis of the company’s ad reach numbers indicates growth of almost 60% over the past 2 years.
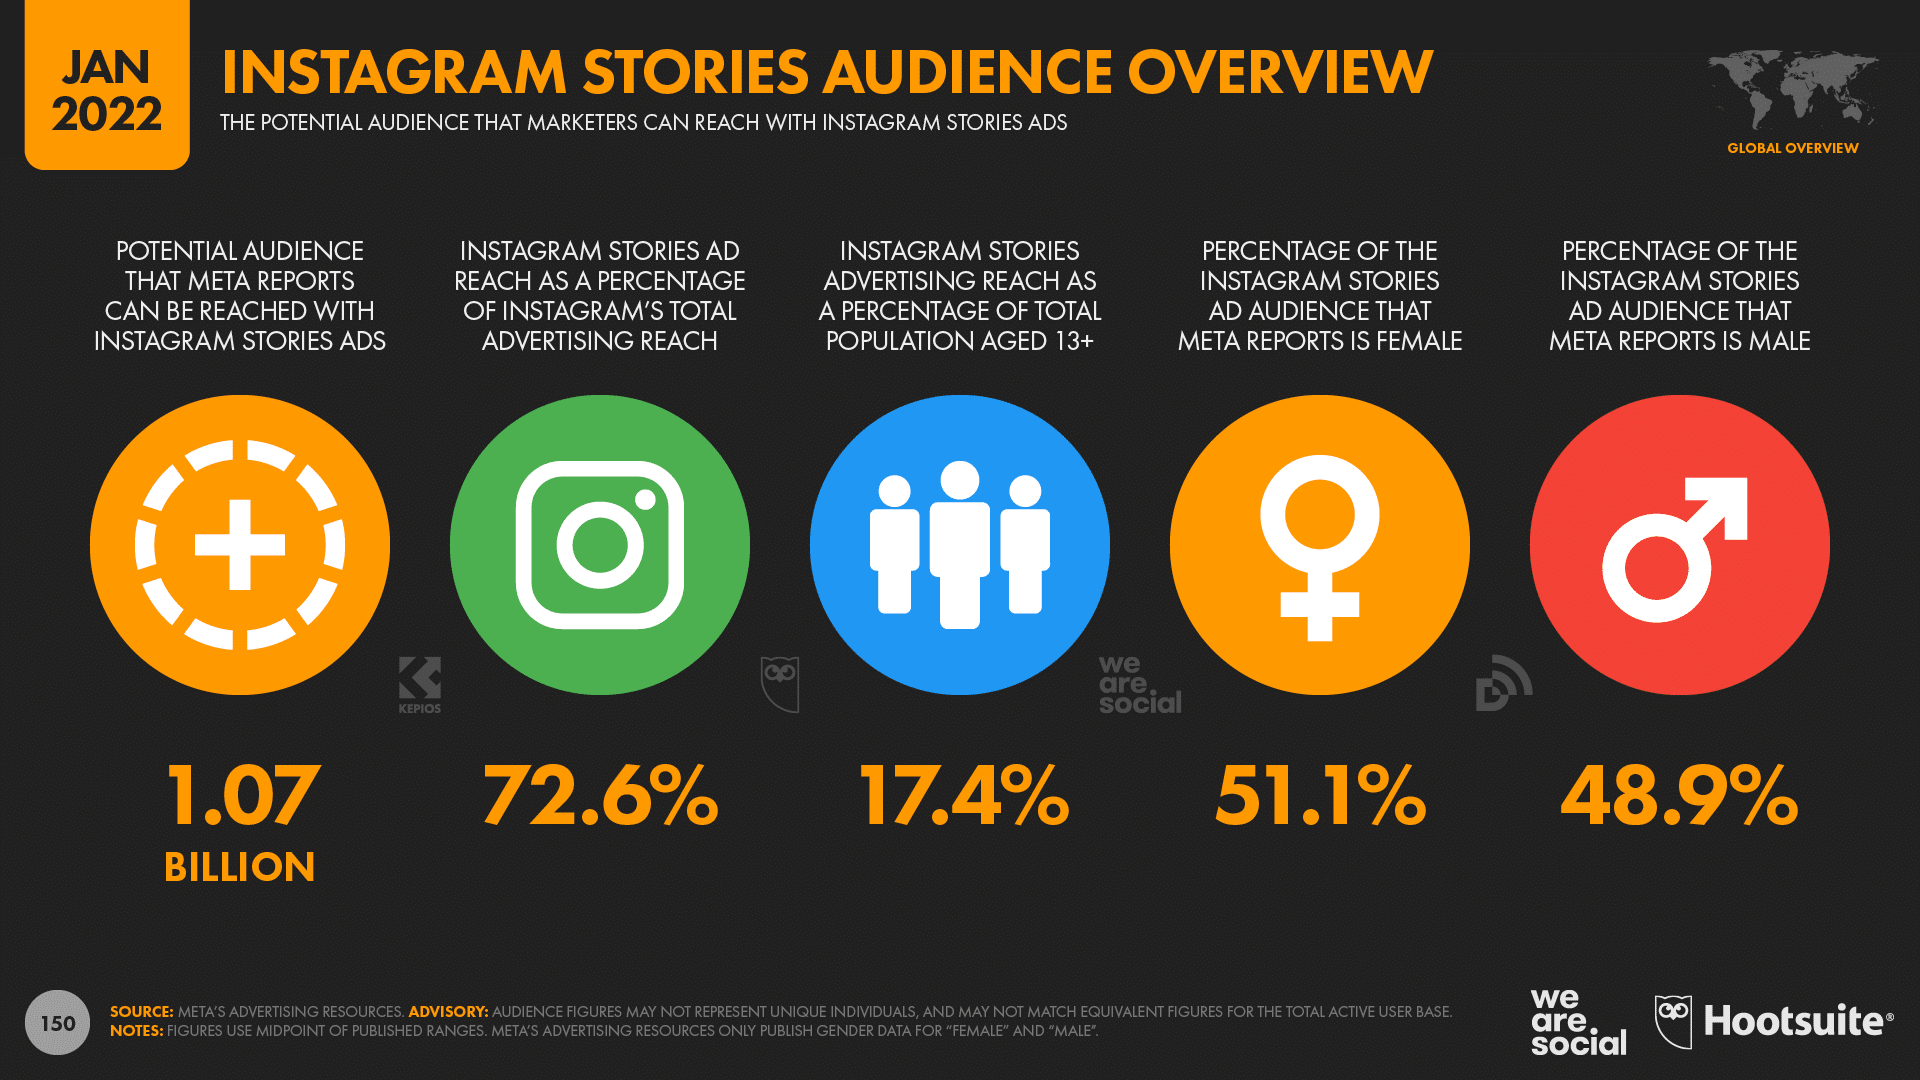
Our Digital 2022 Report also includes data for some of Instagram’s individual ‘environments’, which will be particularly useful for marketers exploring opportunities such as short video formats and social search.
For context, ads in Instagram’s “home feed” reach almost all (96.6%) of Instagram’s active user base each month, so these placements remain the surest way to reach the largest Instagram audience.
However, ads in Instagram Stories now reach more than 1 billion users each month, and—with the format’s additional functionality and creative options—the Stories environment represents an ever more compelling opportunity.
Meanwhile, slightly less than 800 million users also see ads in Instagram’s Explore tab each month.
This finding may have added relevance for marketers launching new brands and products, because users browsing the Explore tab are more likely to be looking for new content, ideas, and inspiration.
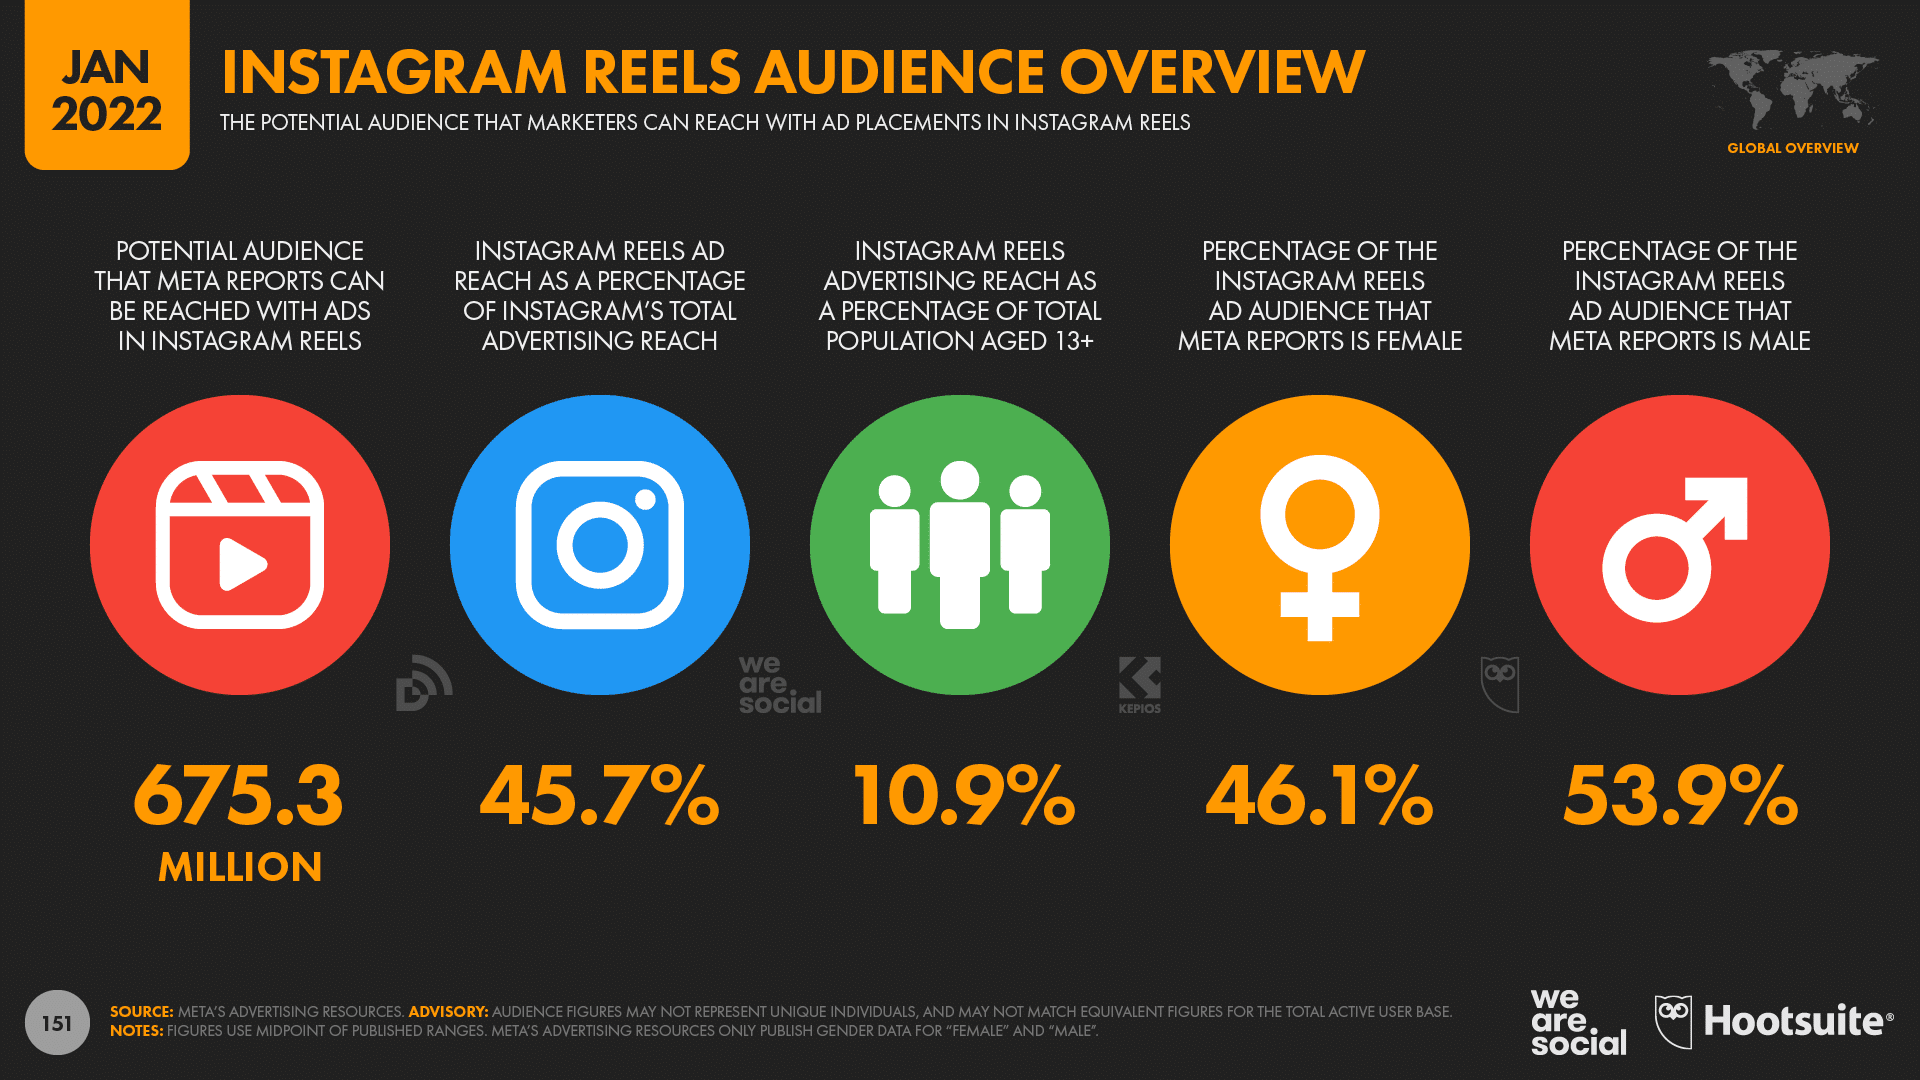
Reels haven’t quite gained the same momentum as Stories yet, but data reveals that 675 million Instagram users still see ads in the platform’s dedicated video tab each month.
We’ll take a closer look at Instagram Shop in the social commerce section later in this article.
TikTok’s rapid rise isn’t slowing anytime soon
TikTok’s ad audience also continues to grow at an eye-watering pace.
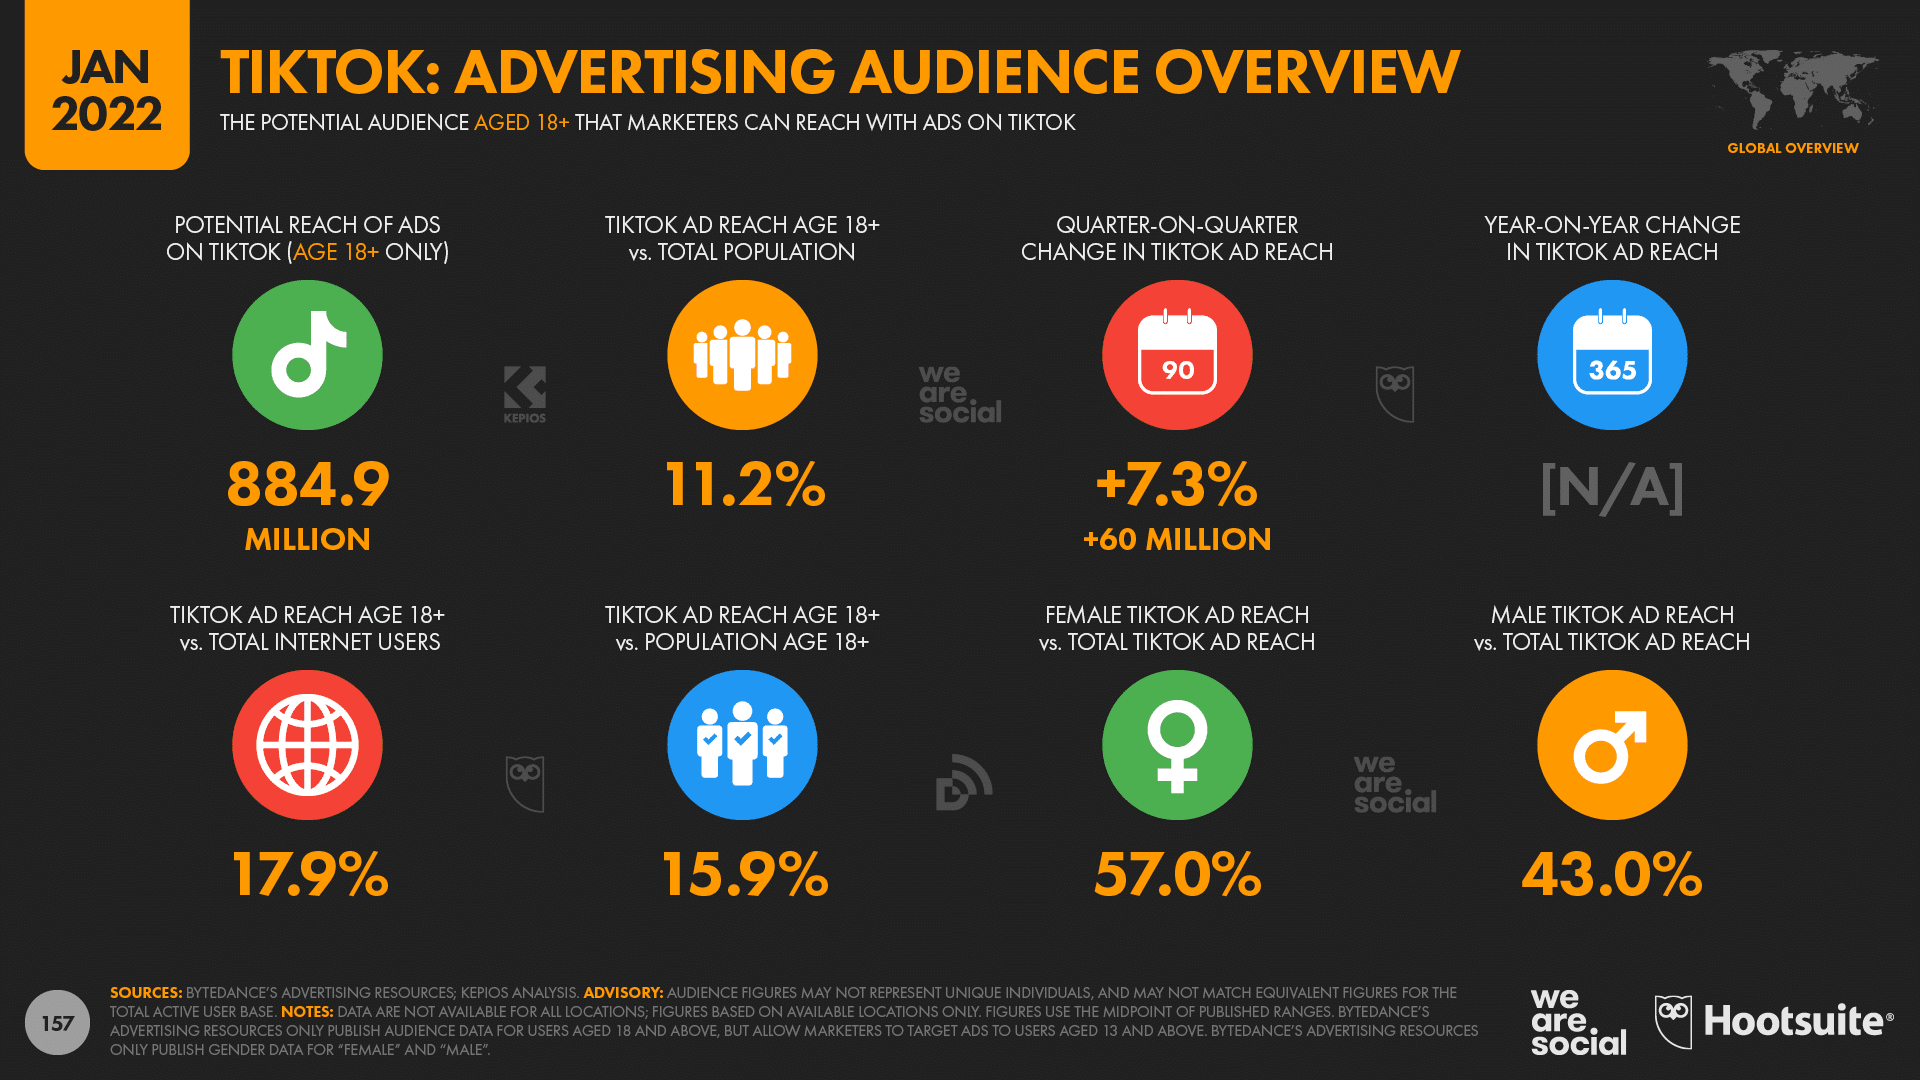
The latest figures published in Bytedance’s advertising resources indicate that TikTok’s ad reach increased by 60 million users (+7.3%) in just the past 90 days, taking worldwide ad reach to roughly 885 million by the start of 2022.
However, it’s important to stress that this figure doesn’t include users below the age of 18, who likely make up a sizeable share of the platform’s total active user base. [Note: due to what the company describes as “data security requirements”, Bytedance’s tools only show ad reach data for audiences aged 18 and above, although marketers can still target ads to users aged 13 and above.]
The latest data suggest that TikTok has been adding an average of more than 650,000 new users every day over the past three months, which equates to almost eight new users every second.
And what’s more, despite stereotypes, TikTok isn’t just popular with younger users.
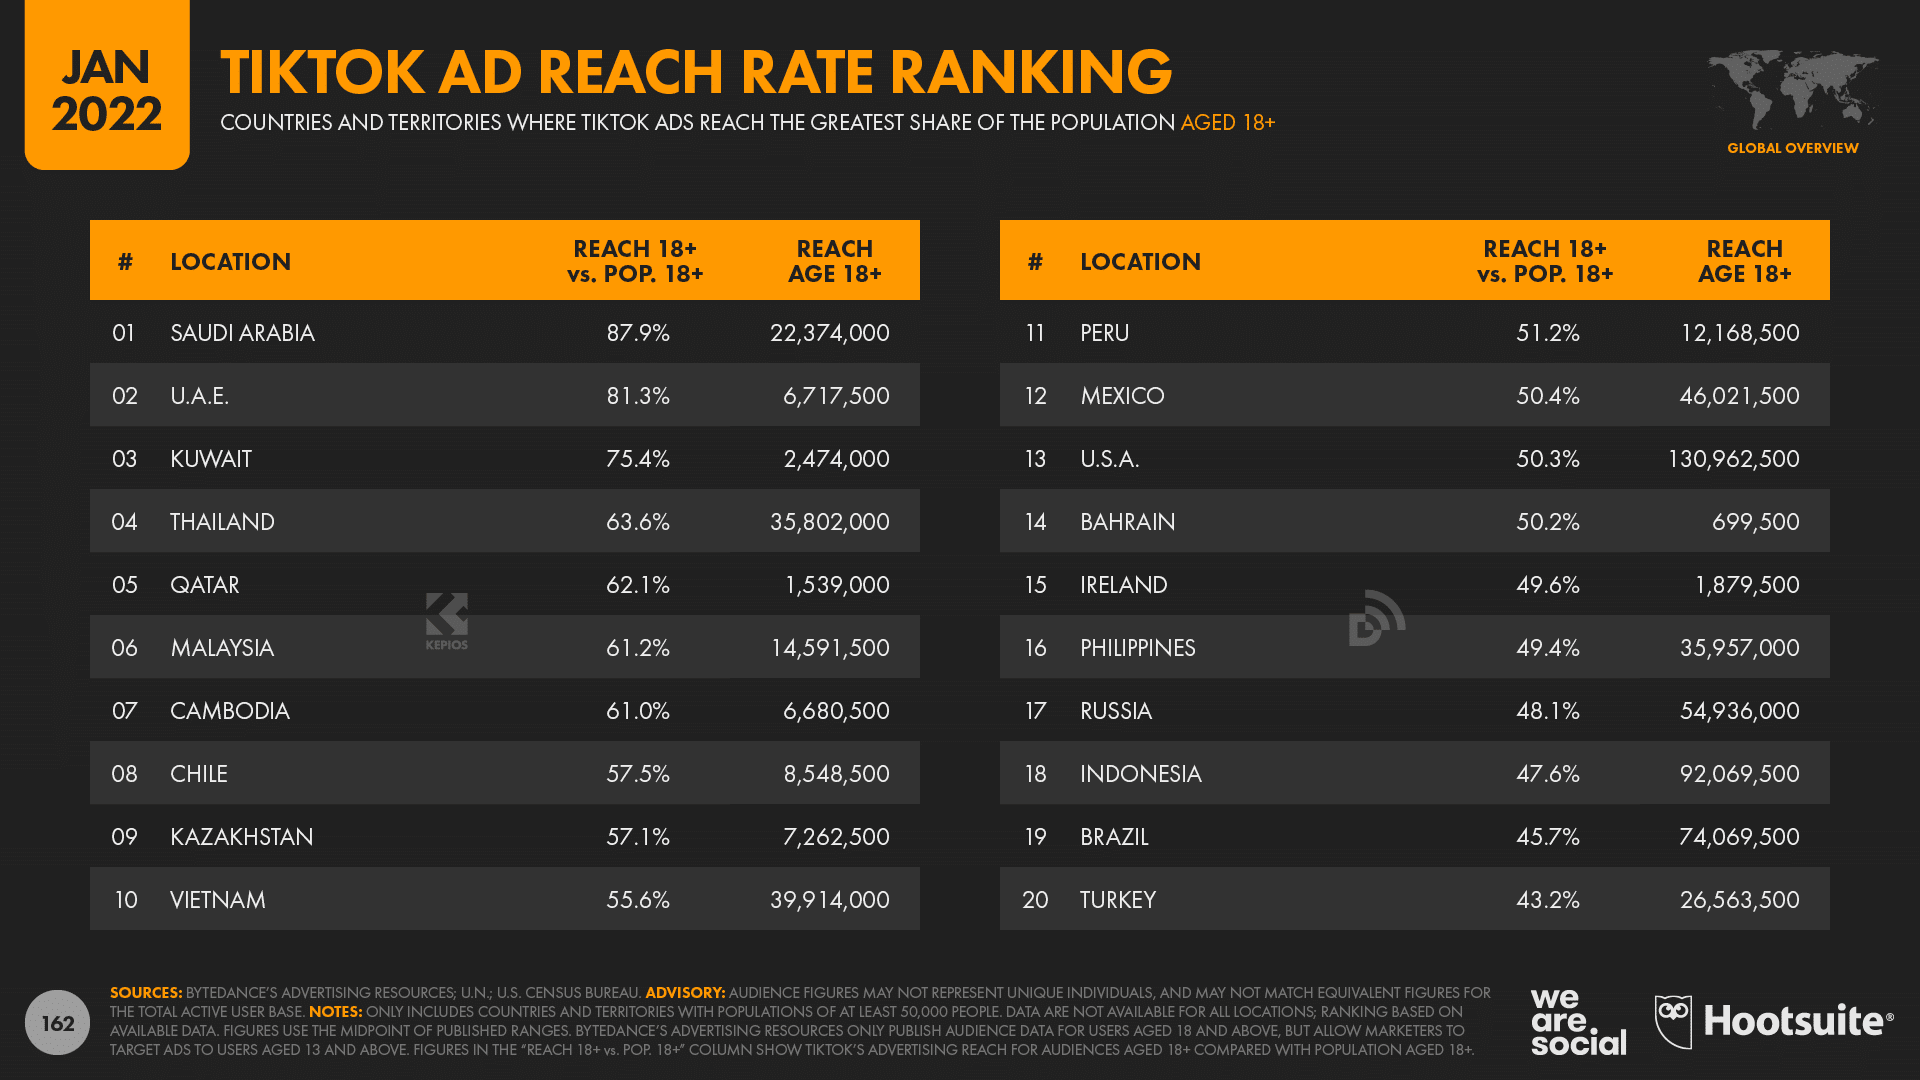
Ad audience data for TikTok users aged 18 and above indicates that more than three-quarters of all adults in Saudi Arabia, the United Arab Emirates, and Kuwait already use the platform.
Meanwhile, TikTok users aged 18 and above in the United States now equate to more than half (50.3%) of all American adults.
As with all social media audience data in our Global Digital Reports, “users” may not represent unique individuals, but either way, it’s clear that TikTok has already made a huge impression around the world, and is also an increasingly popular choice.
YouTube’s ad reach passes 2.5 billion
Our latest analysis reveals that ads on YouTube now reach more than 2.5 billion users, with that figure increasing by a hefty 11.9% (+271 million users) over the past 12 months.
What’s more, these figures only account for users in around 75 of the world’s larger economies, so there’s a very good chance that the total reach of YouTube ads is considerably higher than these published figures suggest.
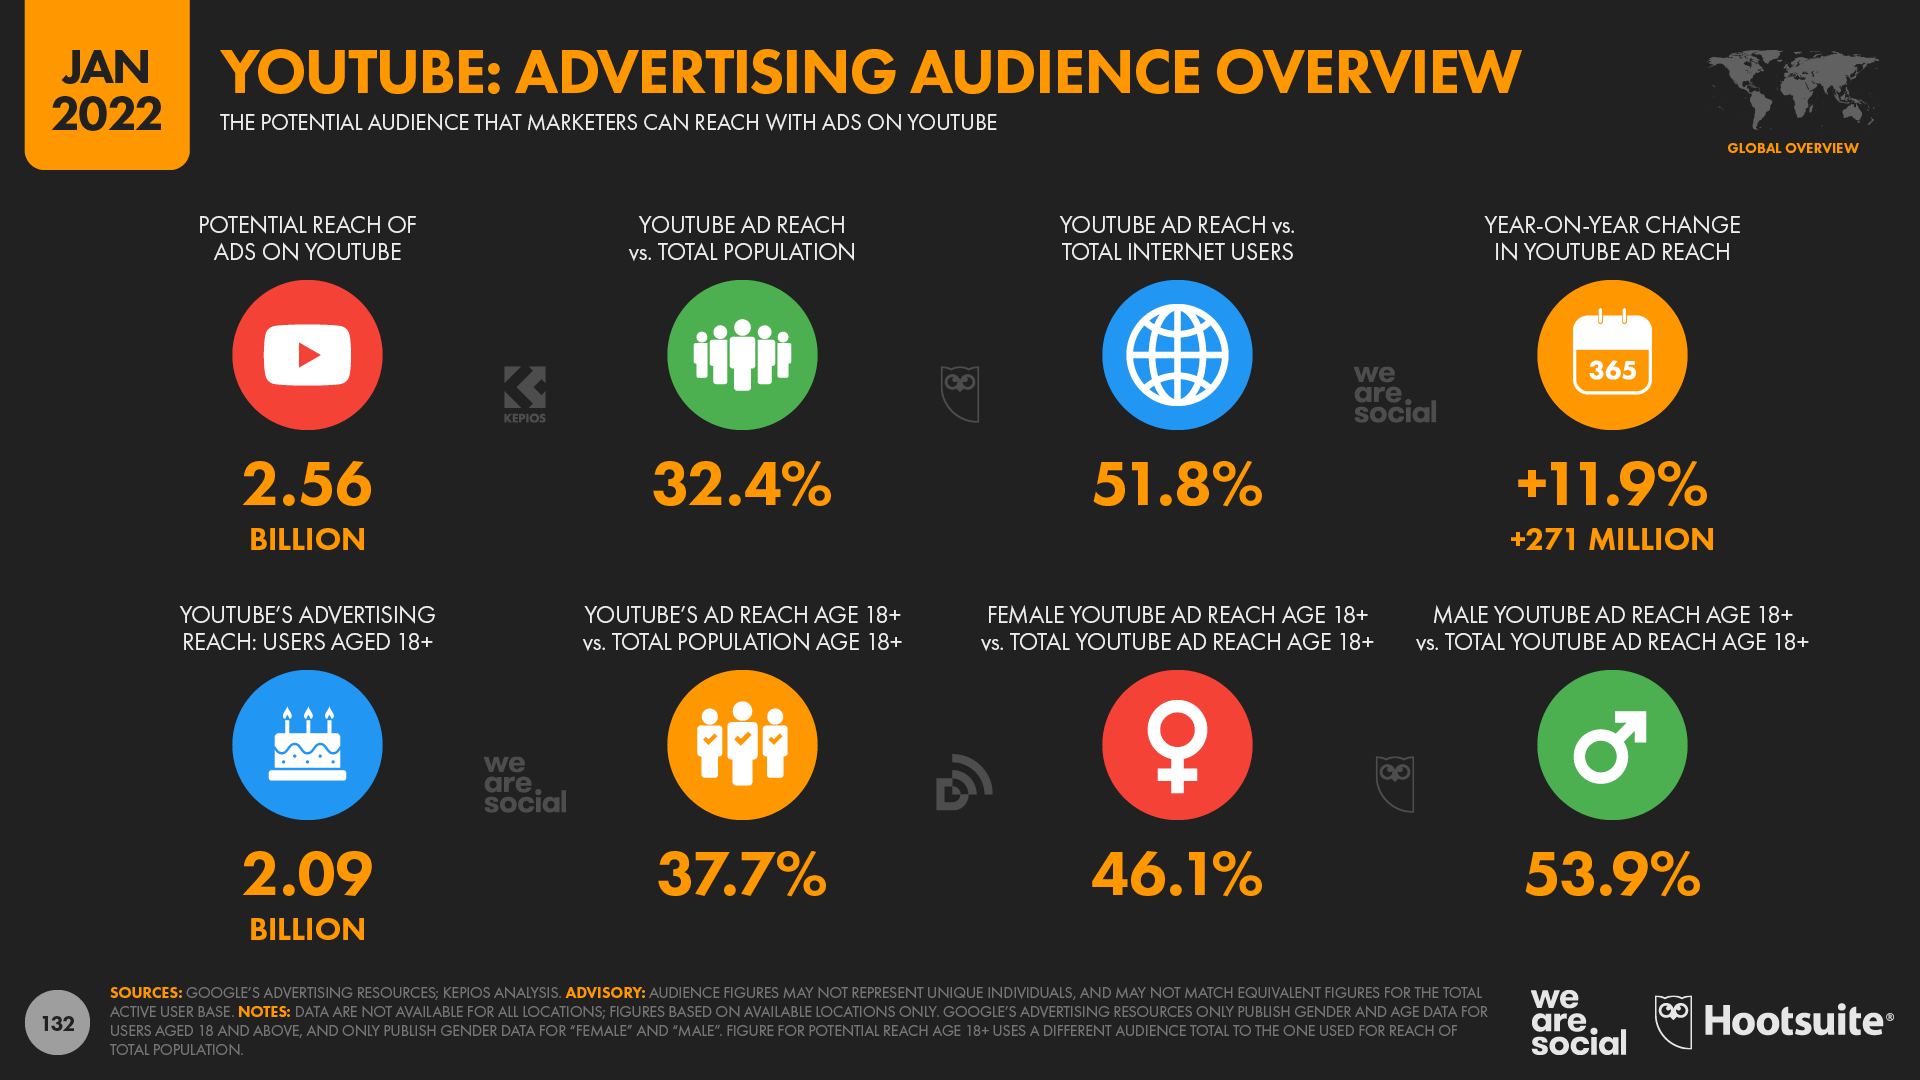
The available data indicates that YouTube ads now reach roughly one in three people on Earth, with that figure rising to 37.7% of adults aged 18 and above.
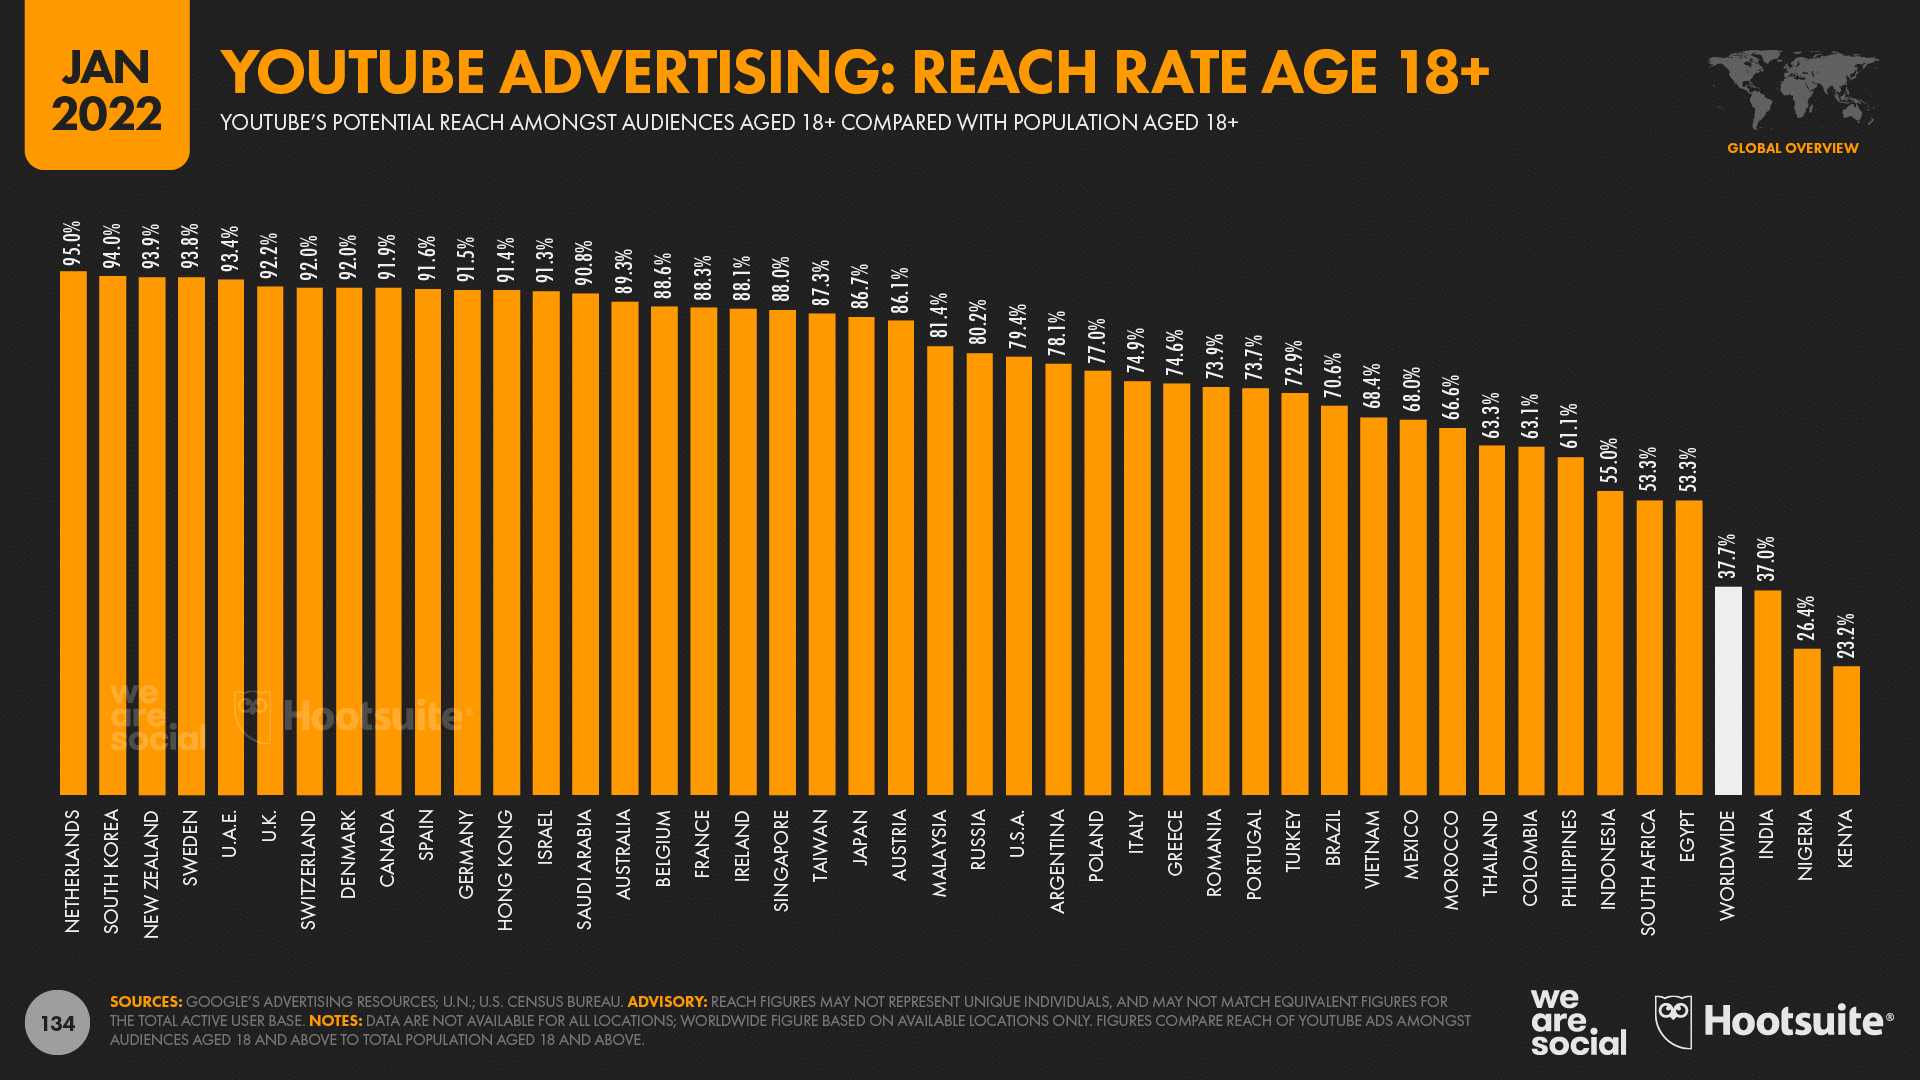
However, if we focus only on those countries for which data are available, a far more impressive story emerges.
YouTube ads now reach more than three-quarters of adults aged 18 and above across most of the Western world, and more than 90% of all adults in a total of 14 countries.
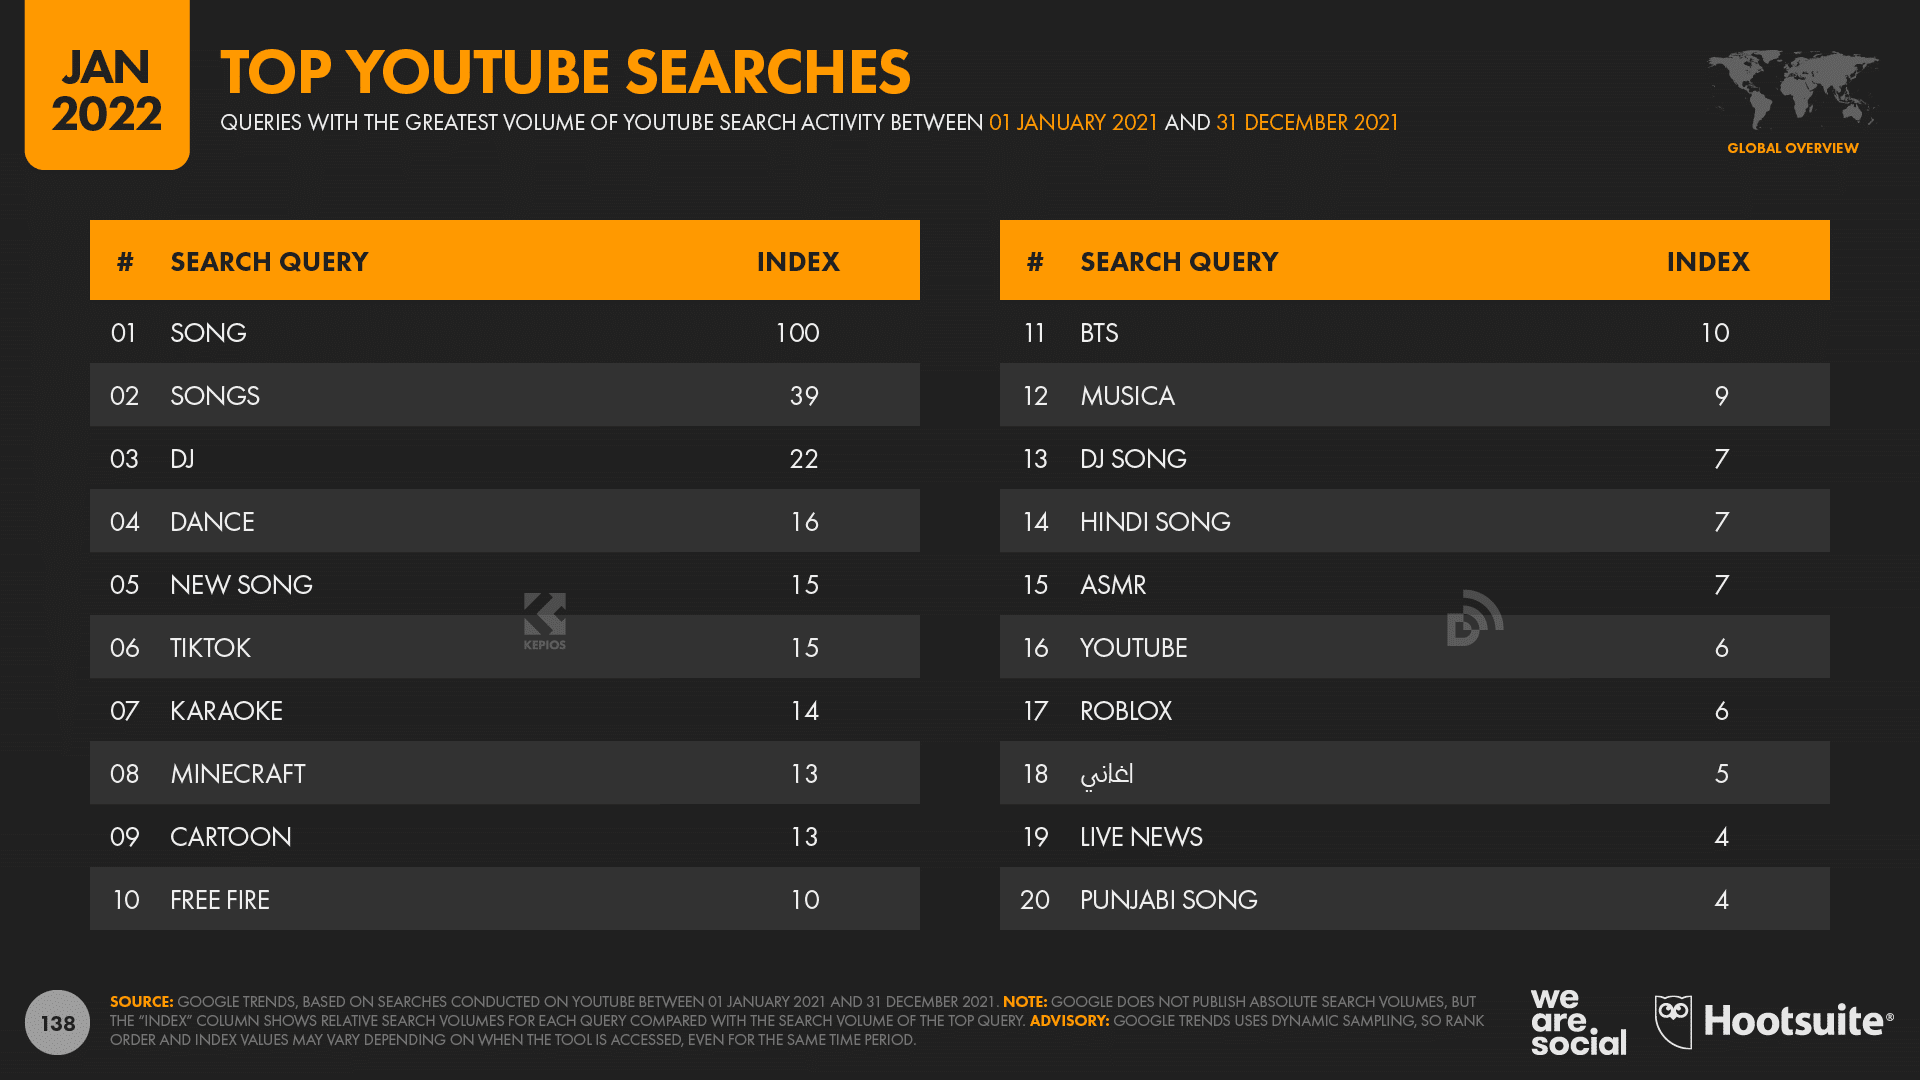
Beyond impressive reach numbers, marketers may also be interested to learn that music is increasingly important for YouTube’s global audiences, with 11 of the platform’s top 20 search terms over the past year relating directly to music.
This trend is also evident in our ranking of the platform’s most-subscribed channels, as well as our updated ranking of the platform’s all-time most viewed videos, both of which you’ll find in the full report.
1 in 4 now use social media for work
GWI’s latest numbers show that almost one in four internet users aged 16 to 64 now uses social media for work-related activities.
However, this figure is considerably higher across many developing economies.
At the top of the scale, more than four in 10 working-age internet users in Kenya (41.5%) say that they use social media for work-related research.
Filipinos and South Africans are also considerably more likely to use social media for work than the global average, with more than one-third of internet users aged 16 to 64 in both countries saying that social media plays a role in their professional activities.
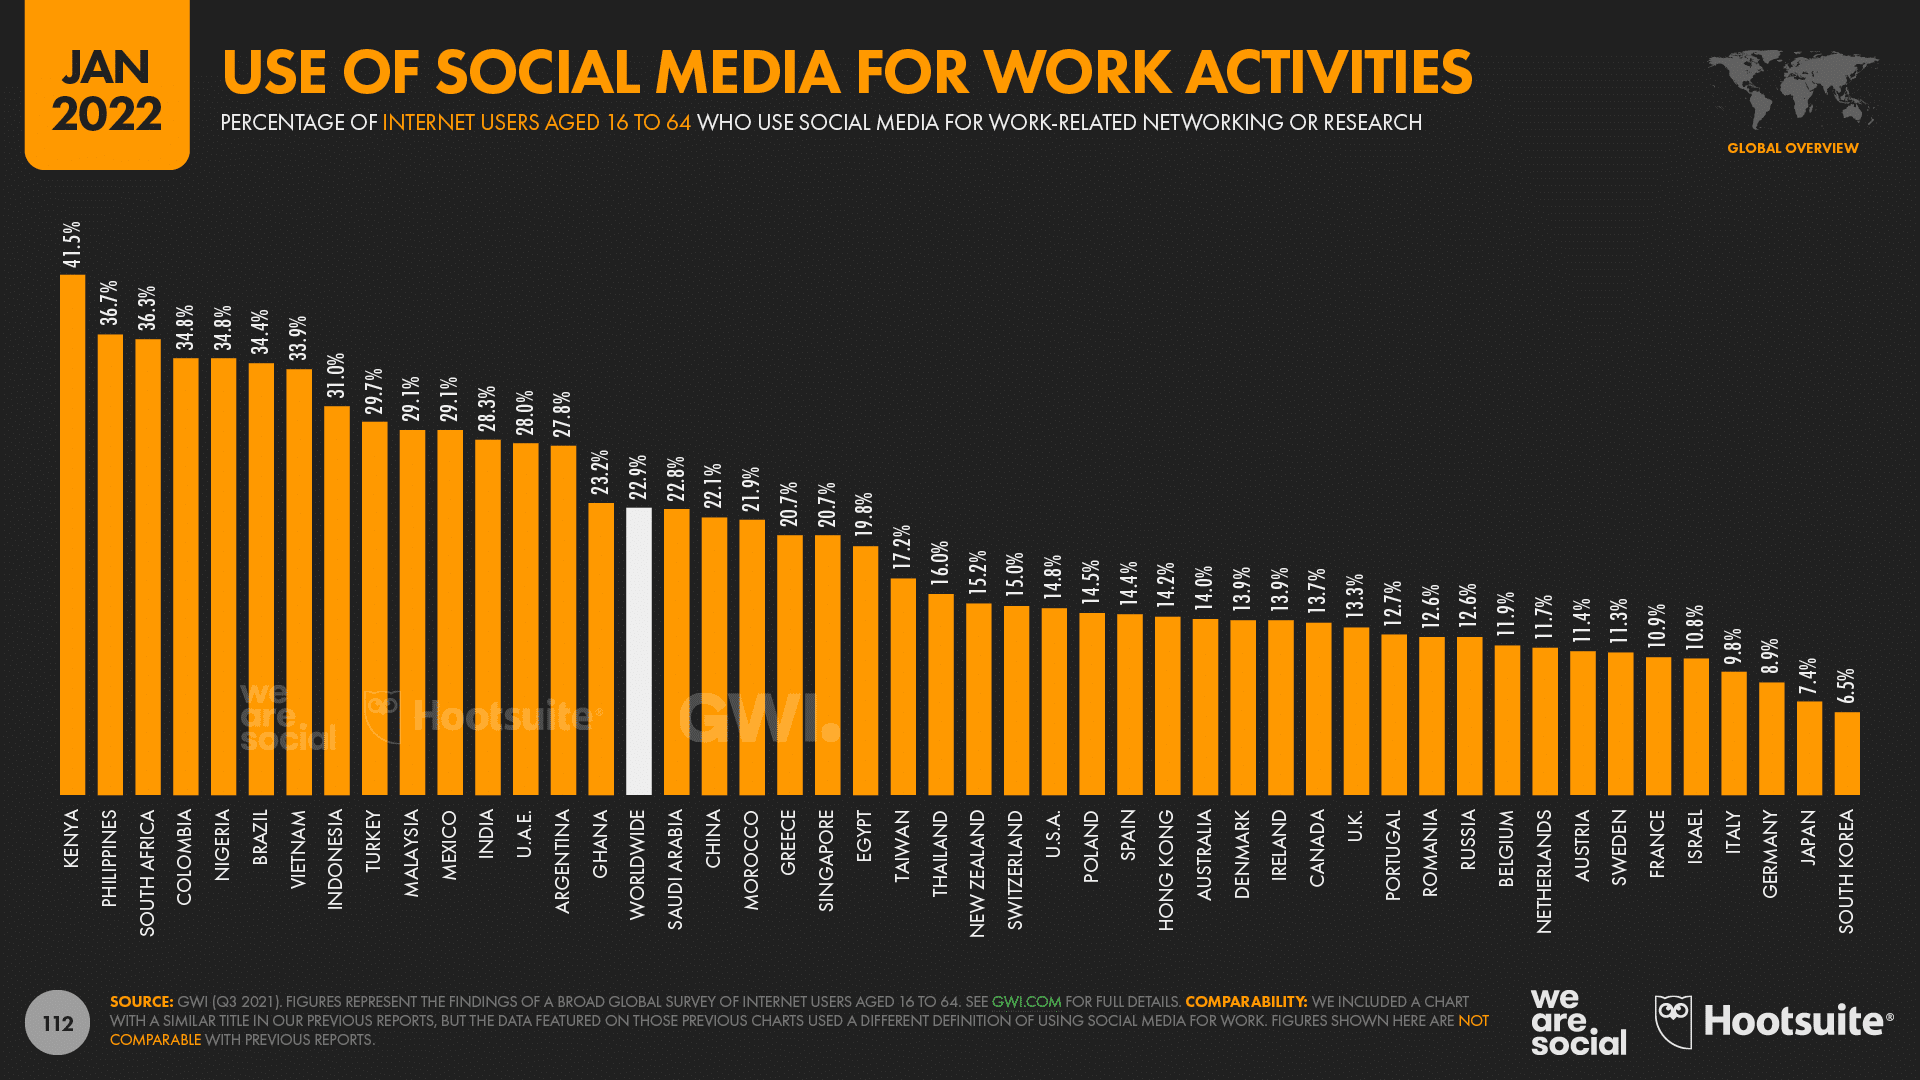
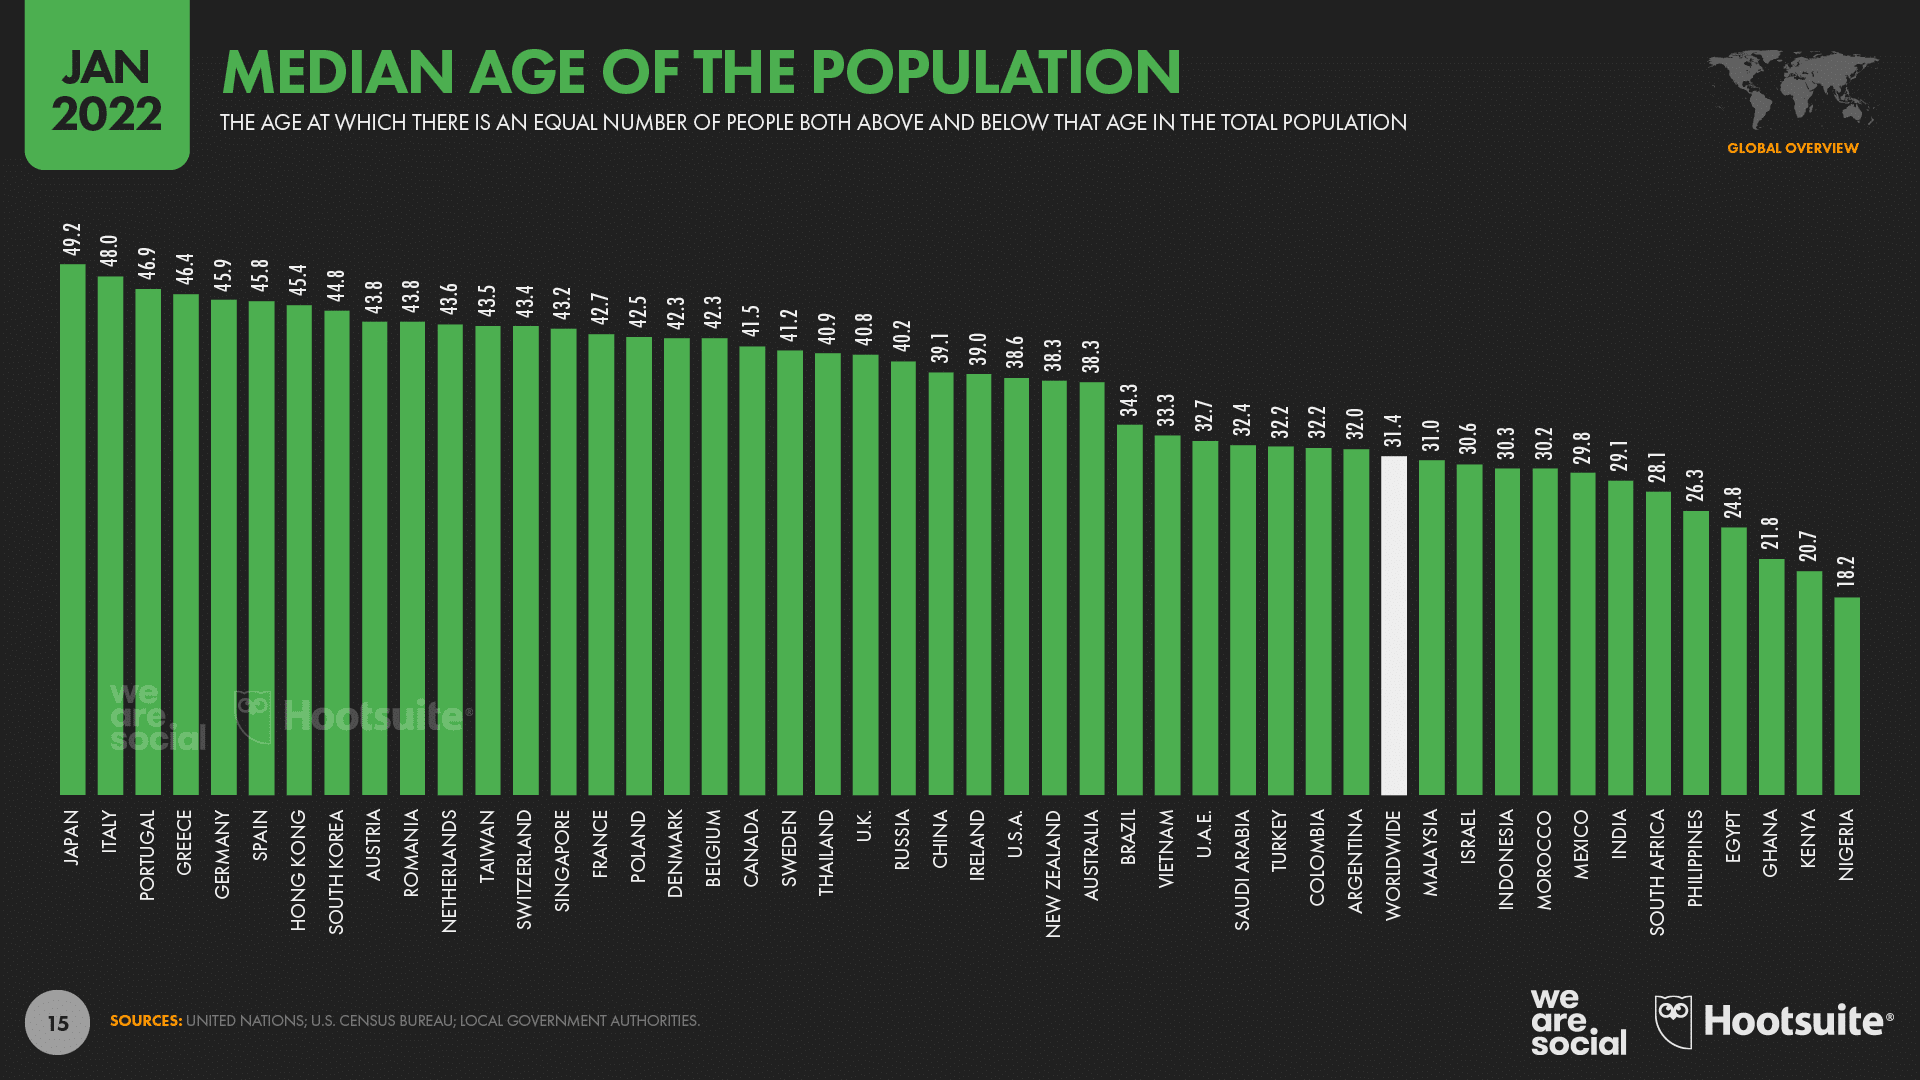
The median age of the overall population appears to play an important role in shaping how likely people in a particular country are to use social media for work, although it’s also worth noting that Greece seems to buck this trend.
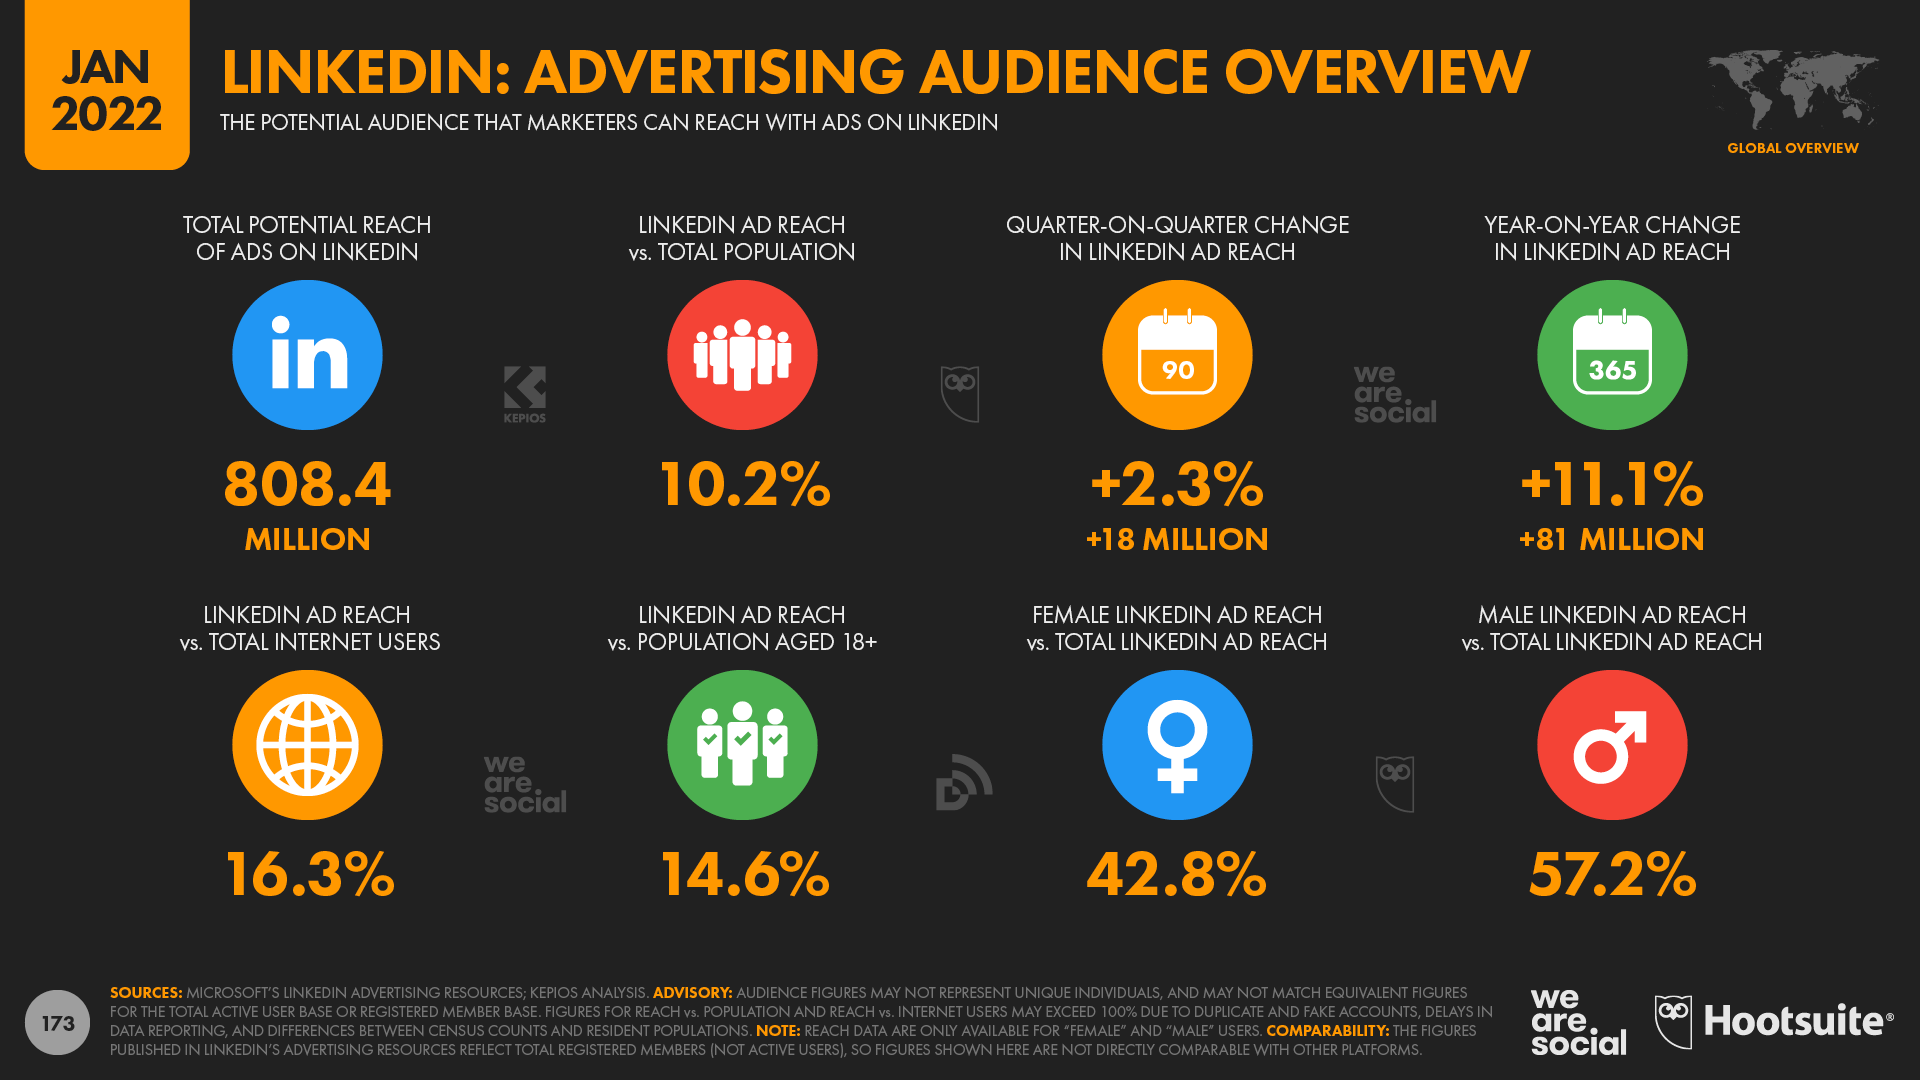
While we’re on the subject of professional social media, it’s also worth noting that LinkedIn has had another impressive year.
Our analysis of data published in the platform’s advertising resources reveals that LinkedIn’s registered member base has increased by 11% over the 12 months (+81 million members), taking the global total to more than 808 million by the start of 2022.
Social media ad spend up 17%
Various data points in this year’s reports reveal that spending on social media ads has jumped significantly over the past 12 months.
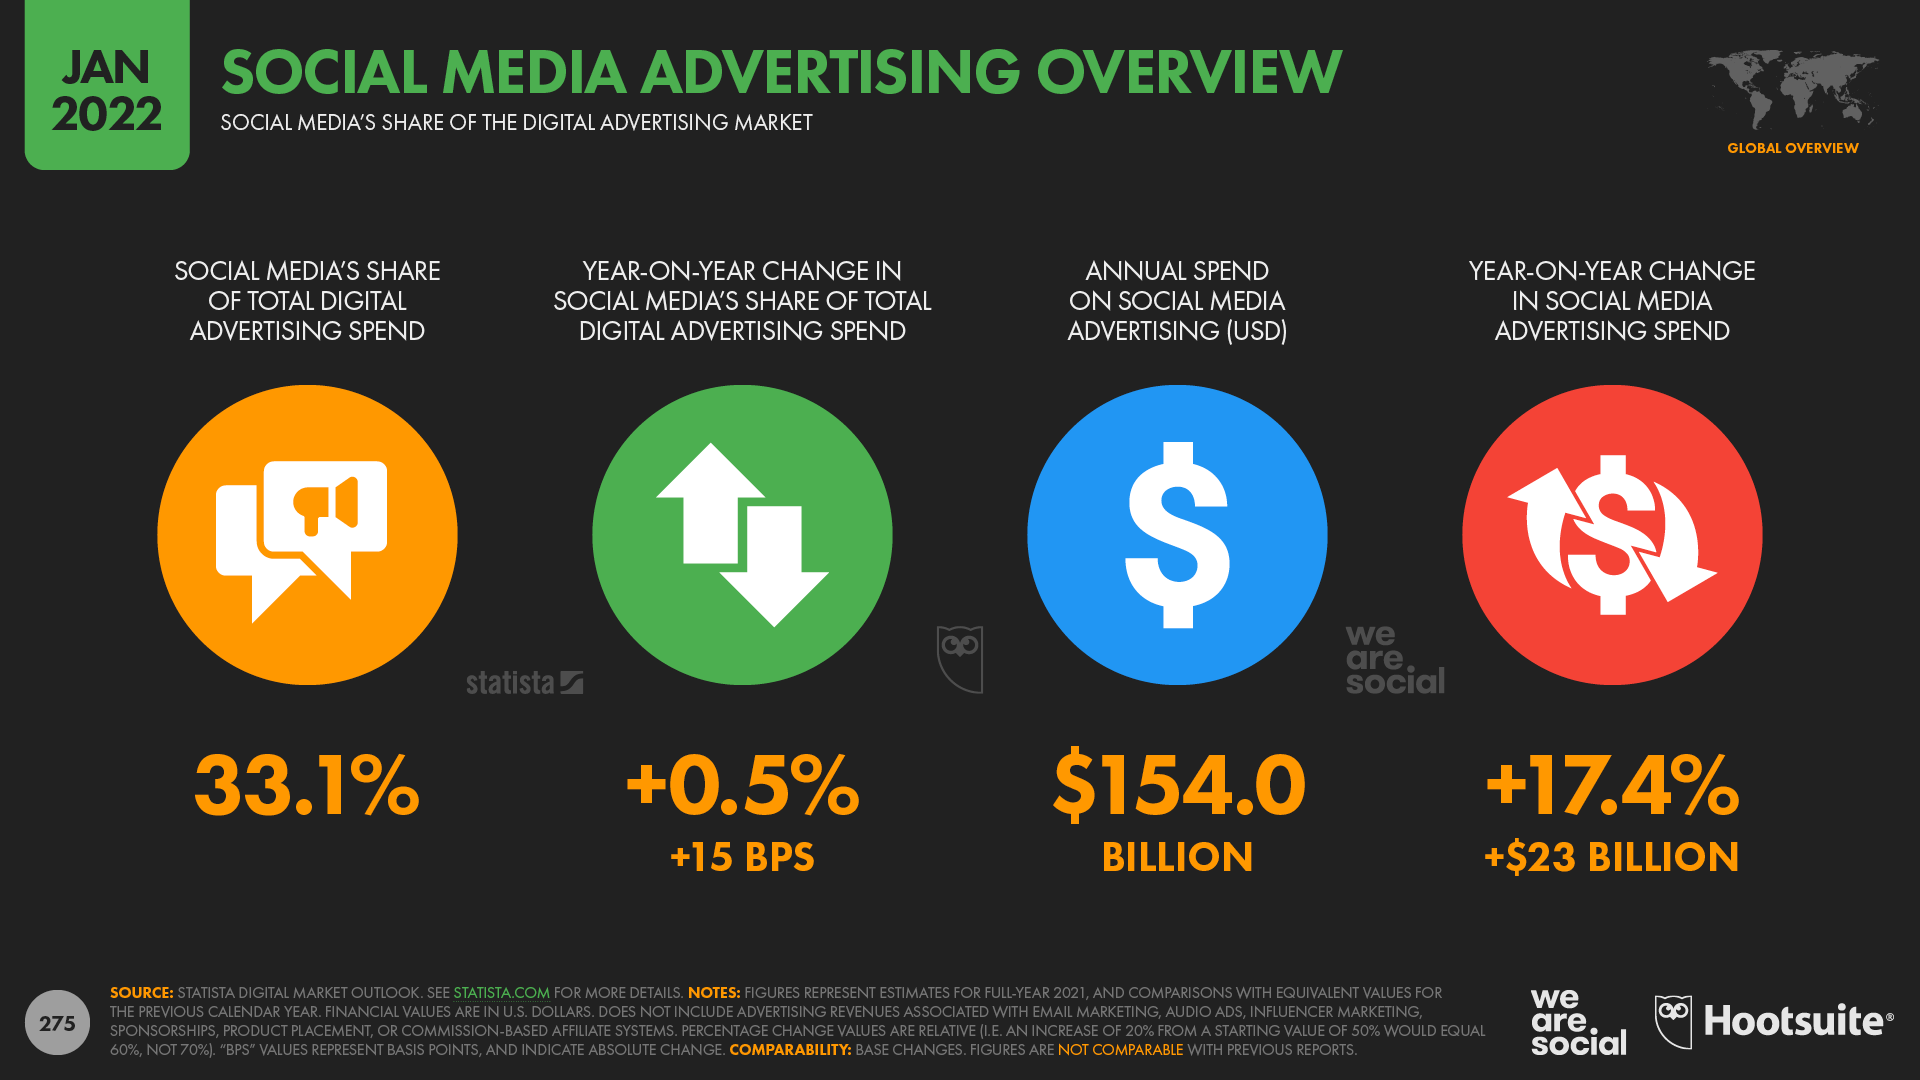
For example, data from Statista shows that global social media ad spend exceeded USD $150 billion in 2021, with social media ads accounting for roughly one-third (33.1%) of total digital spend.
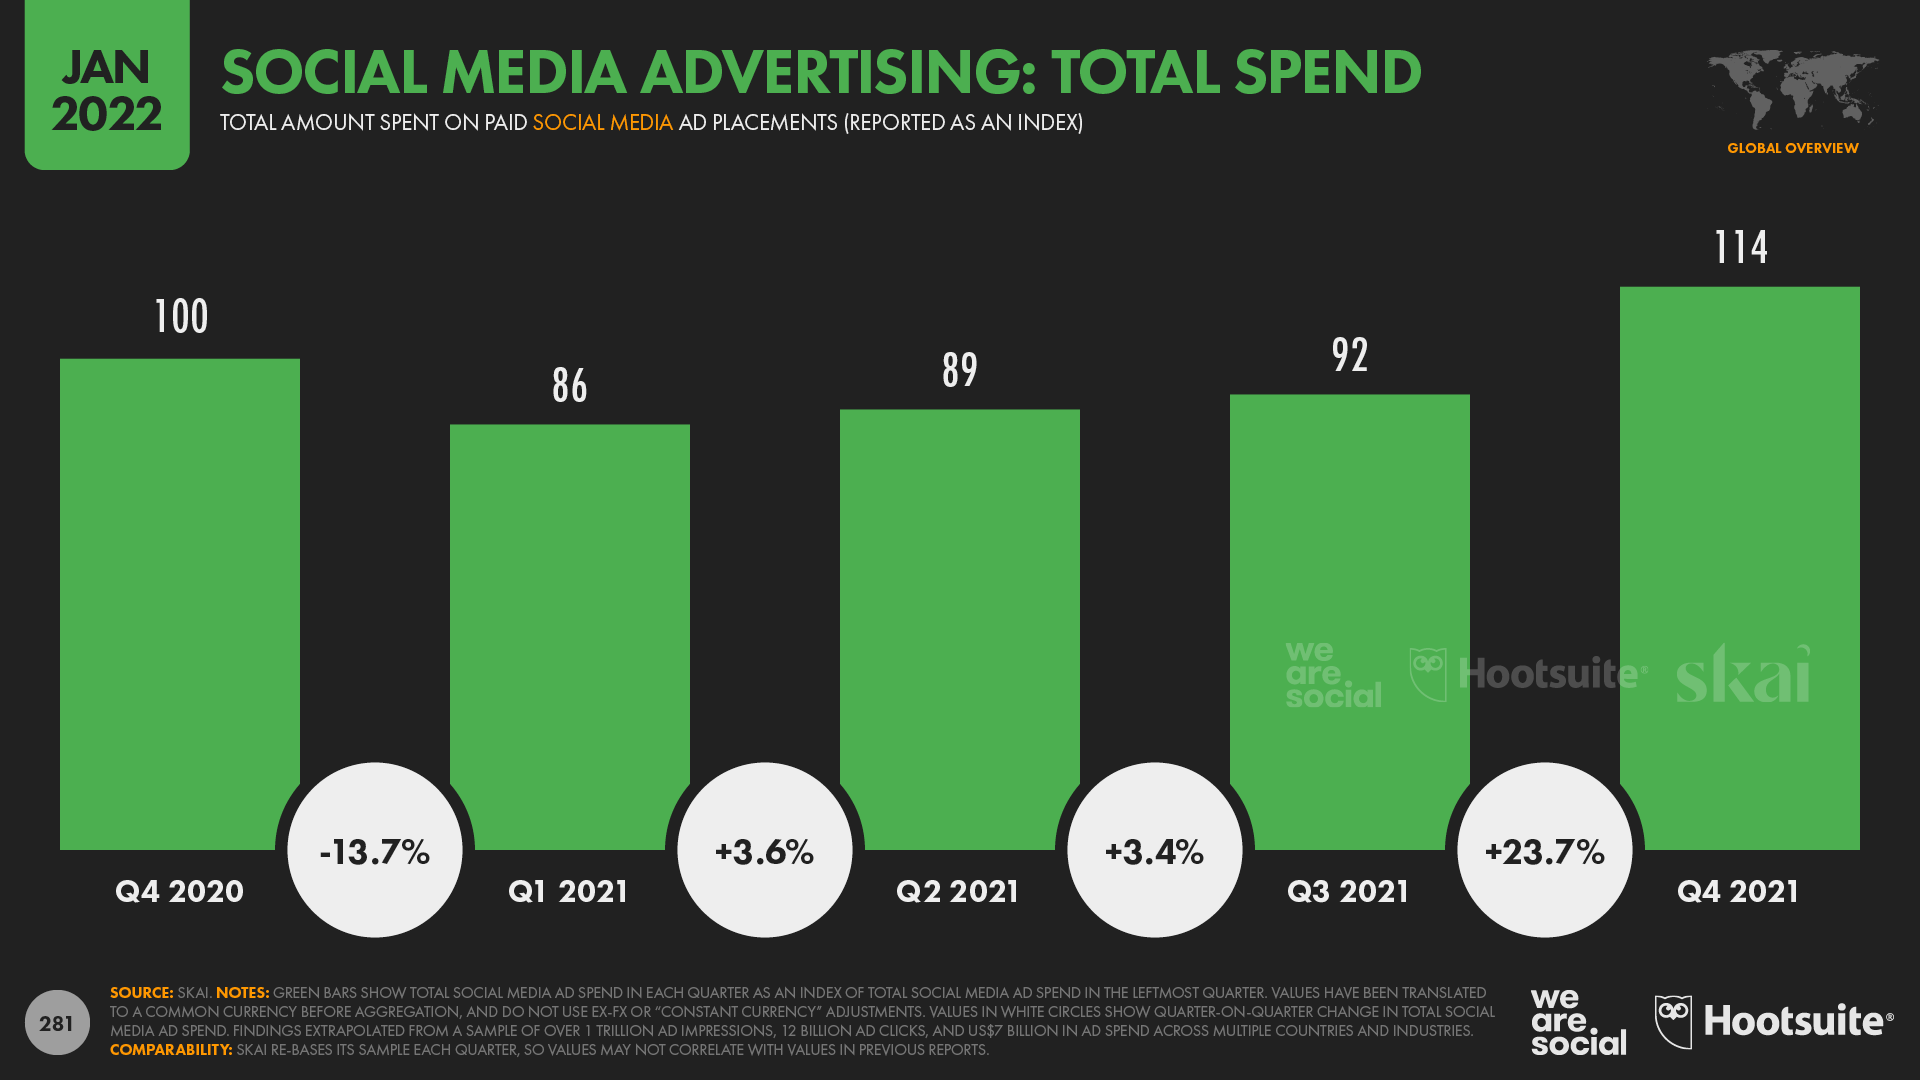
Meanwhile, the latest analysis from Skai shows that advertisers spent 14% more on social media ads in Q4 2021 than they did in the same quarter of 2020.
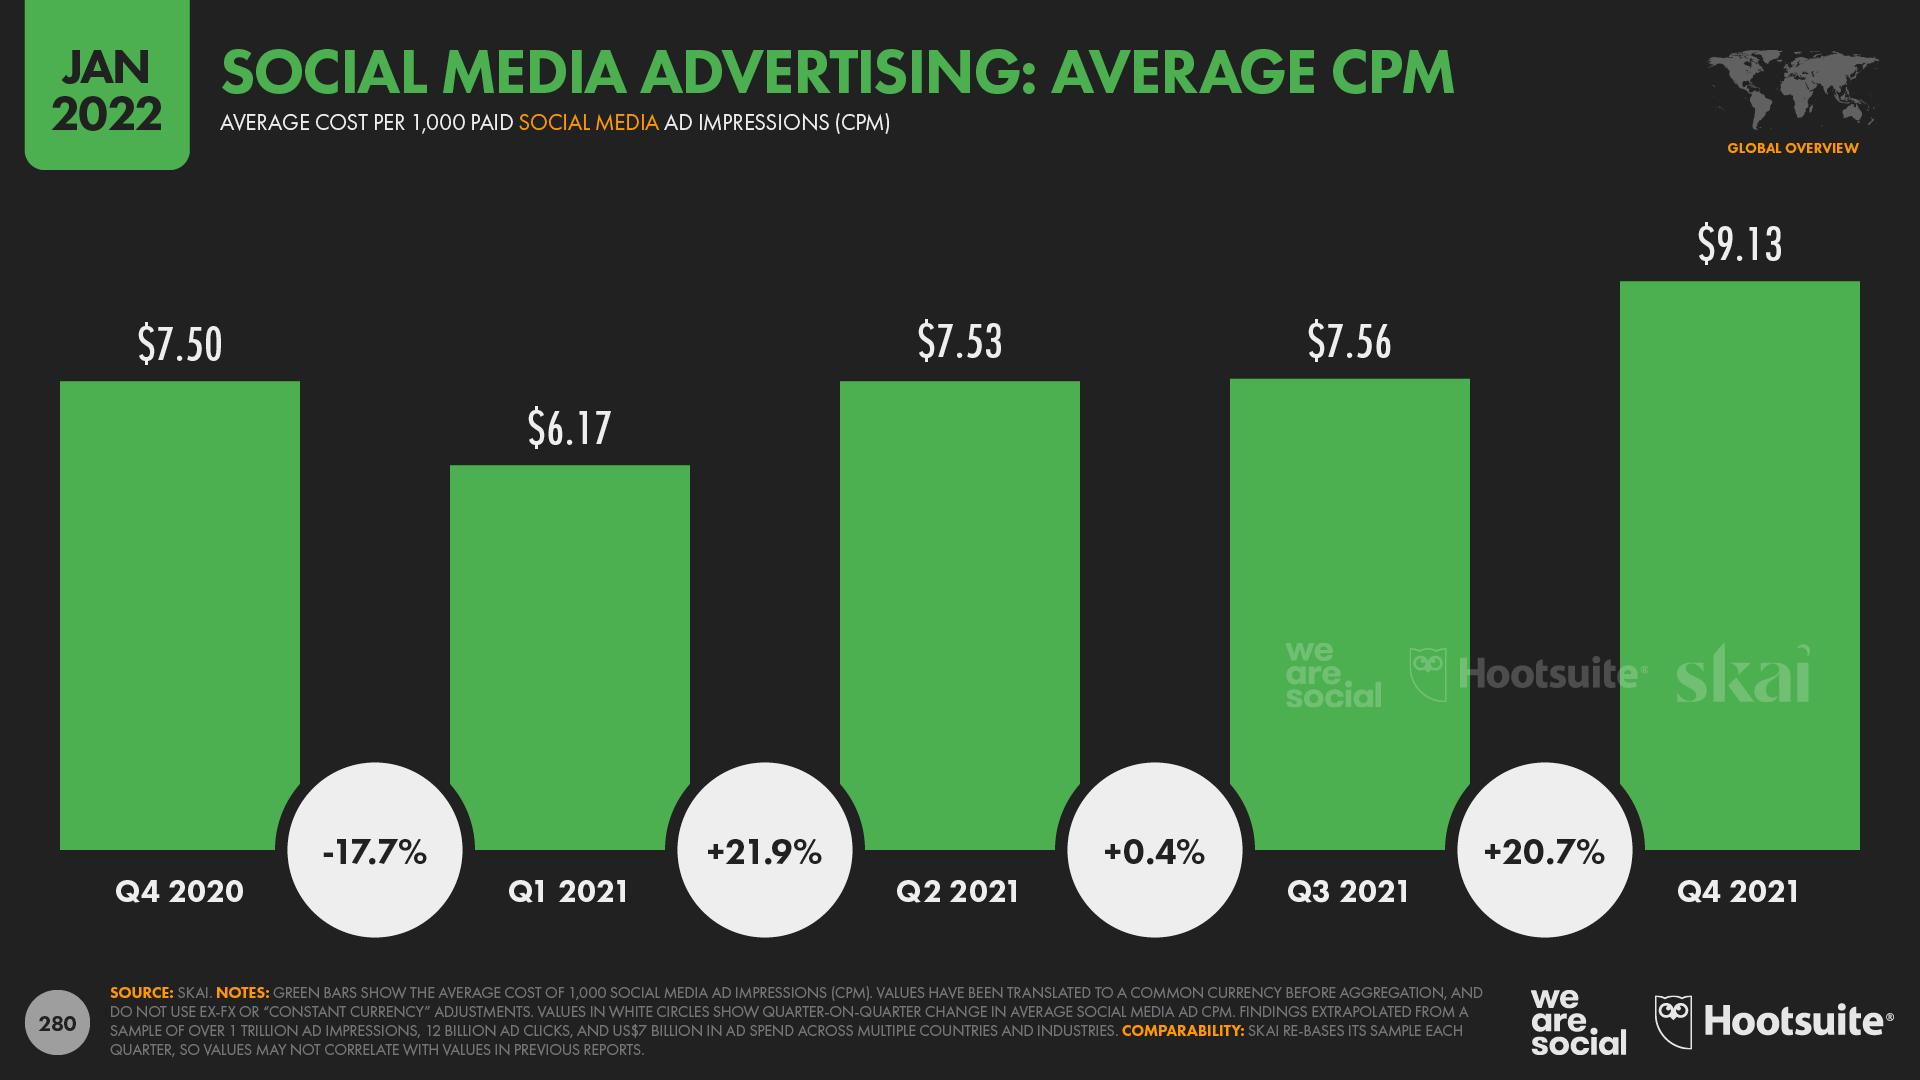
In line with this increase in overall spend, Q4 social media CPMs jumped by 21.7% year on year, with advertisers around the world paying an average of USD $9.13 for 1,000 social media ad impressions across the last three months of 2021.
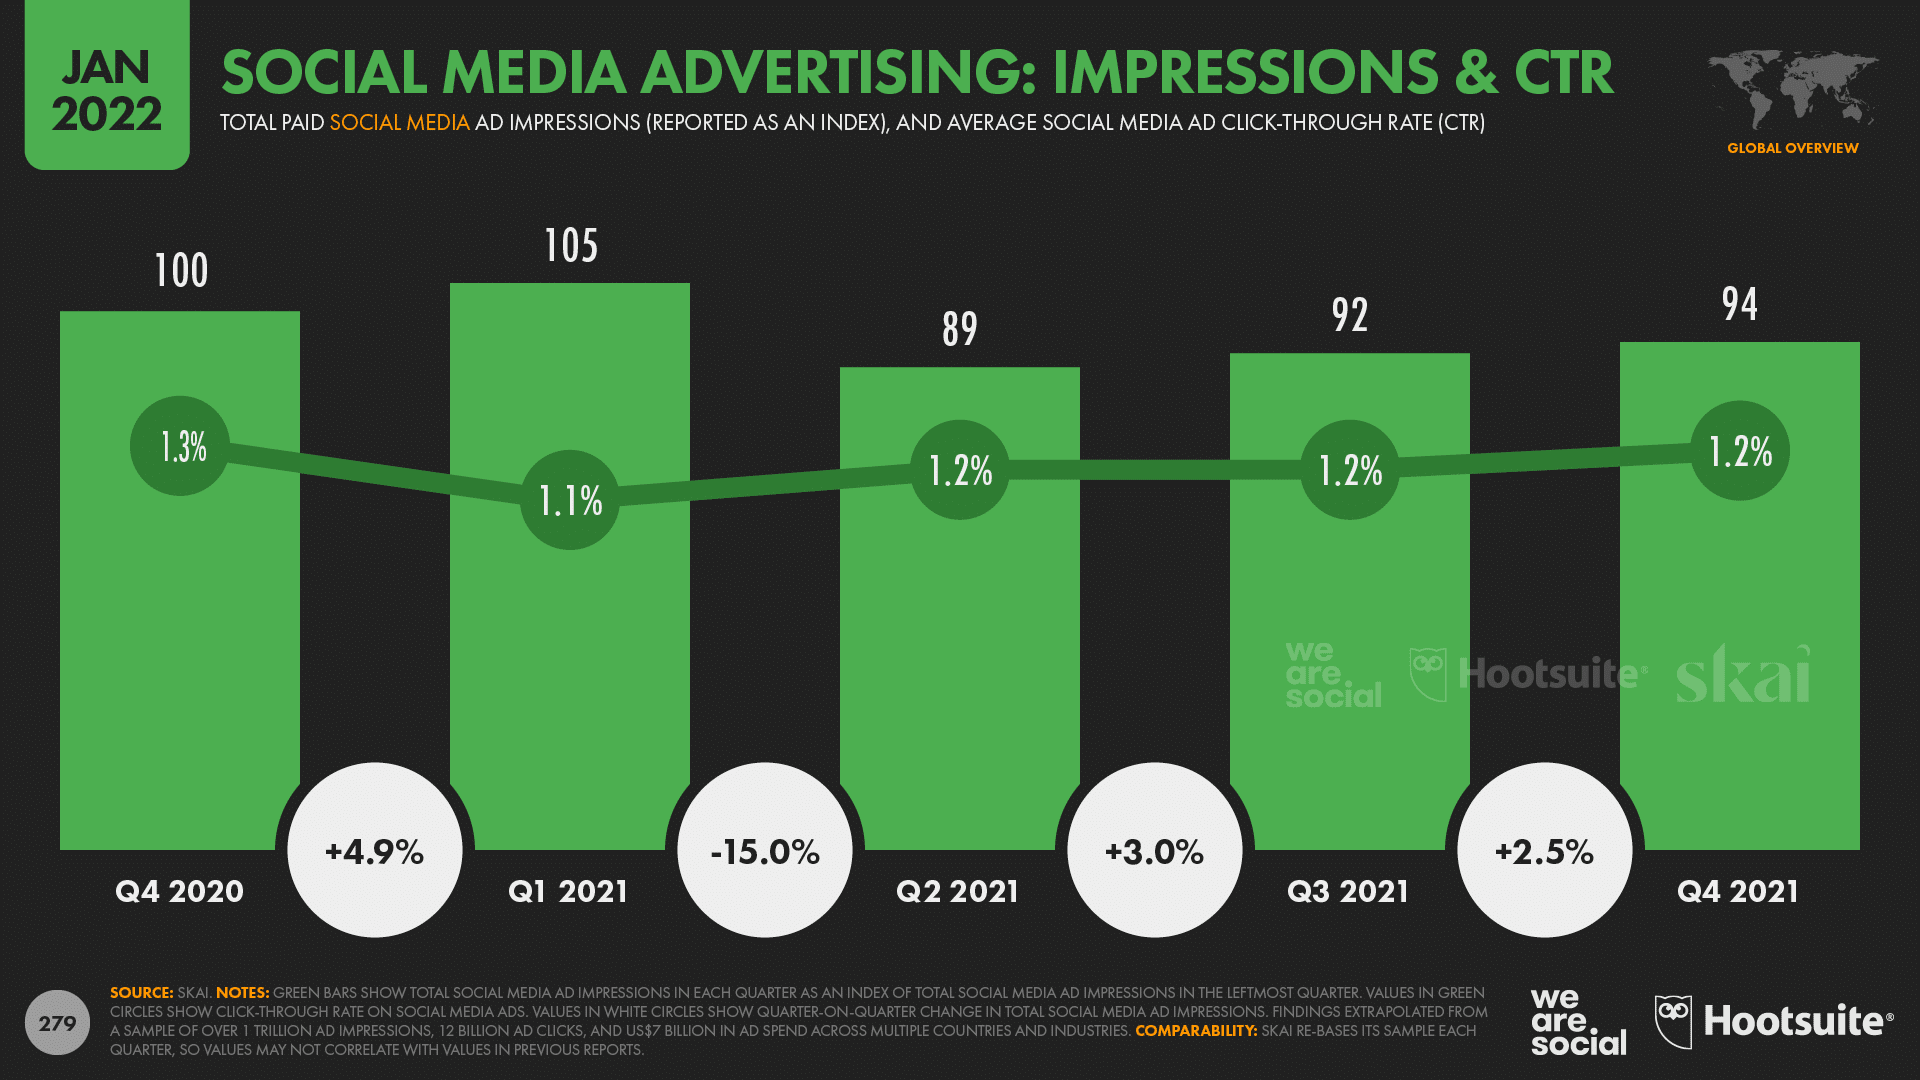
Crucially though, because of the higher average cost per impression, social media advertisers actually delivered fewer total impressions in Q4 2021 compared with the same period in 2020, despite spending more overall.
Social plays major role in brand discovery and research
Despite those rising ad costs, marketers will be reassured to learn that new research confirms the effectiveness of social media advertising.
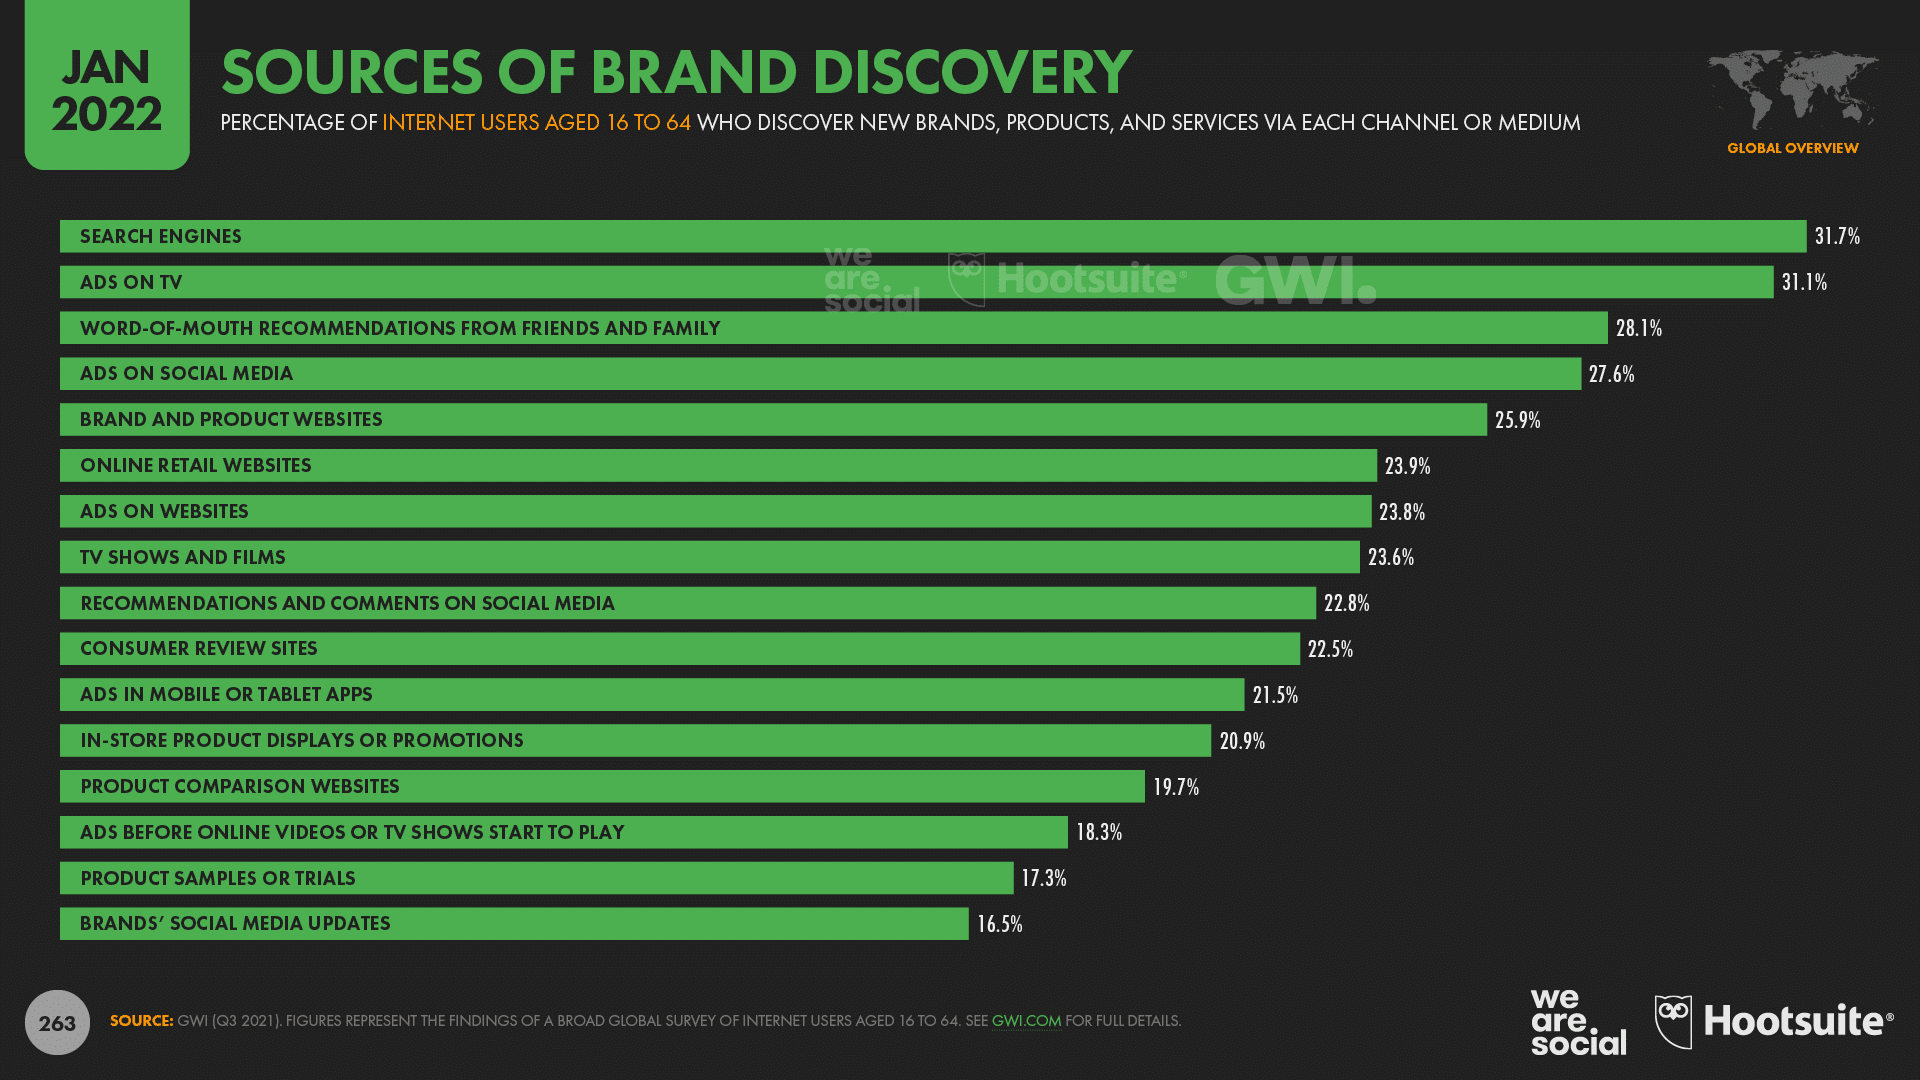
GWI’s latest data reveals that more than one in four internet users aged 16 to 64 (27.6%) discover new brands, products, and services via social media ads, which is only slightly less than the figure for TV ads (31.1%).
Search engines are still the top source of new brand discovery for the world’s internet users though, with 31.7% of GWI’s sample saying that they’ve learned about new brands via an online search.
Meanwhile, word-of-mouth recommendations also rank highly for brand discovery, so marketers may want to re-examine how easy it is for audiences to share their brand and its various online presences via messenger apps like WhatsApp and Telegram.
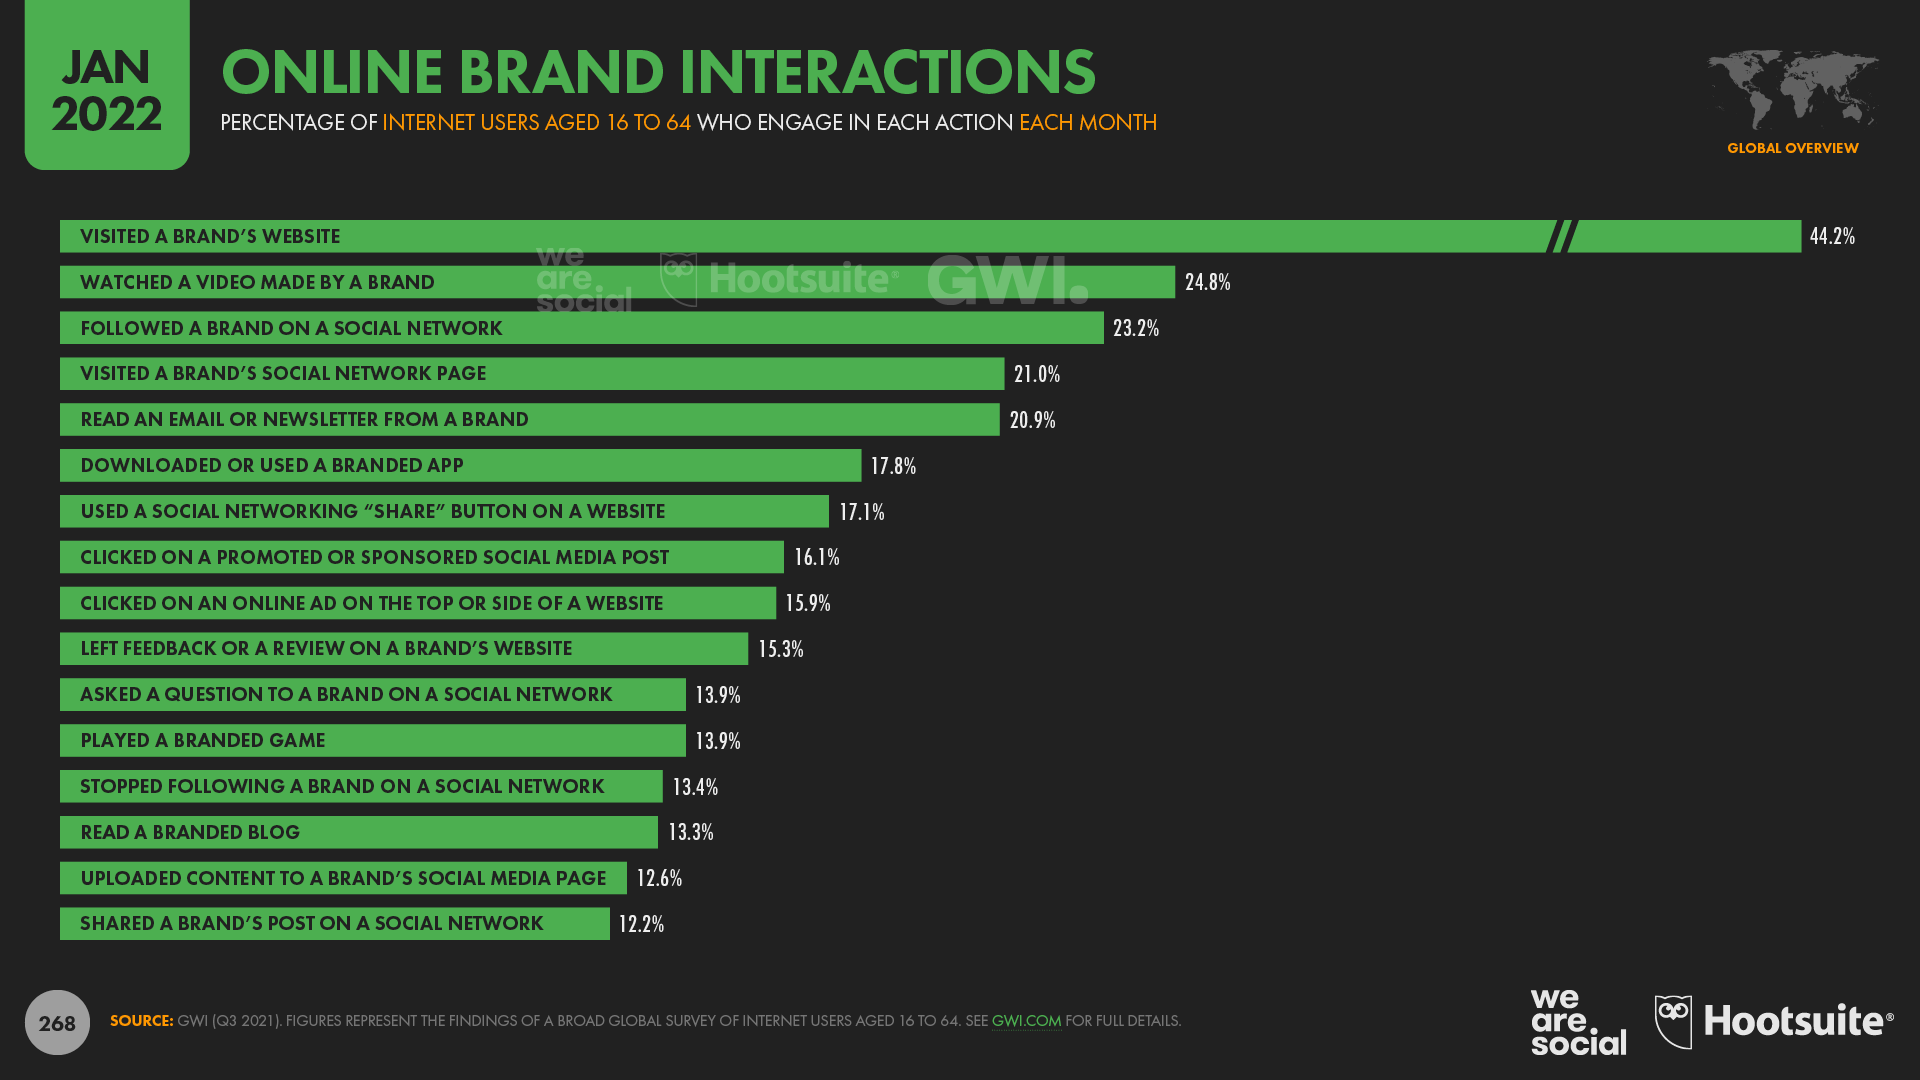
In addition to paid placements, it’s also worth noting that just under one in four working-age internet users (23.2%) actively likes or follows a brand on social media every month, while nearly one in eight (12.2%) says that they share brands’ social media posts at least once per month.
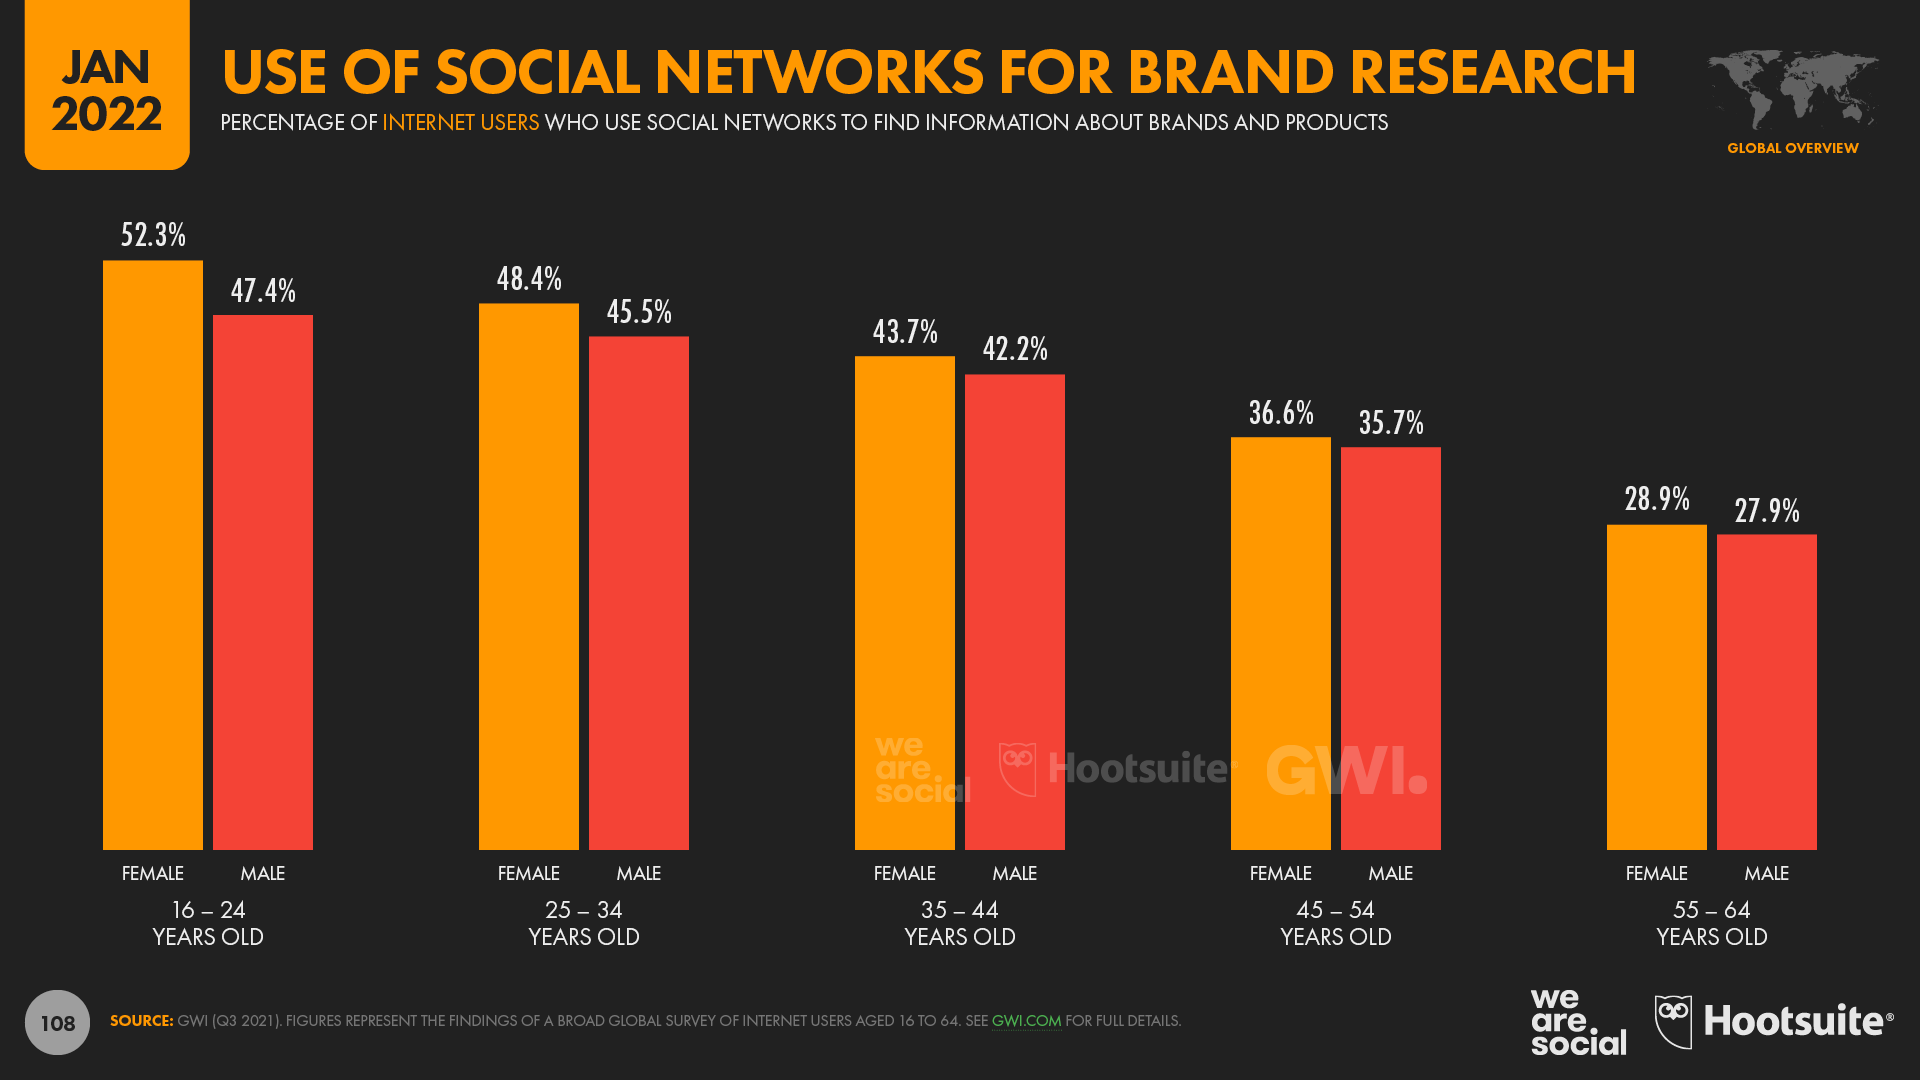
GWI’s research shows that brands’ social media activities play an important role at other stages in the purchase cycle too.
For example, more than four in 10 working-age internet users say that they visit social networks specifically to research brands and products that they’re thinking of buying, with this figure rising to half of all internet users aged 16 to 24.
But alongside all of these positive findings, there are also some more worrying trends in this year’s data.
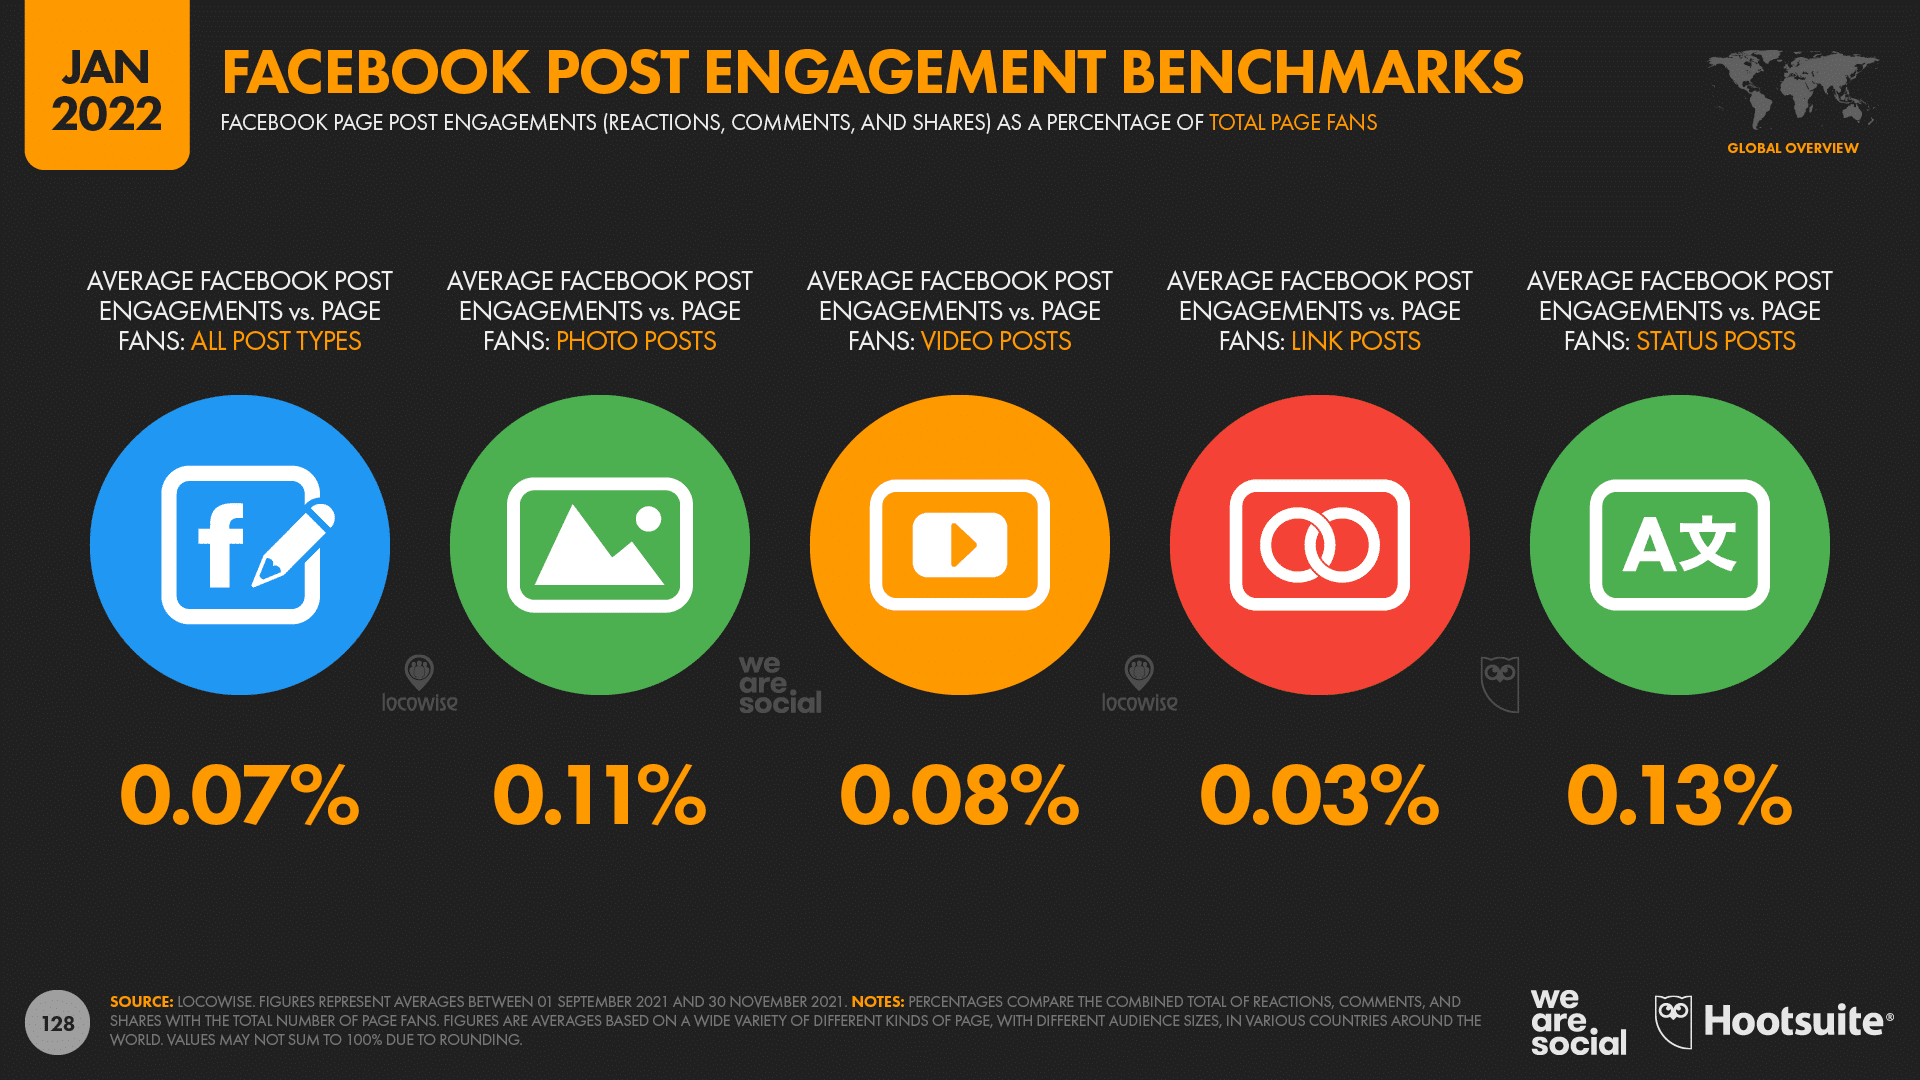
For example, the latest data from Locowise indicates that Facebook pages can now expect an average engagement rate of just 0.07%.
That means that, on average, only seven fans in every 10,000 will react to, comment on, or share any given post.
And even more disturbingly, that average falls to just 0.05% for pages with more than 100,000 fans.
Related: explore insights into social media marketing effectiveness in Hootsuite’s Social Media Trends 2022 report.
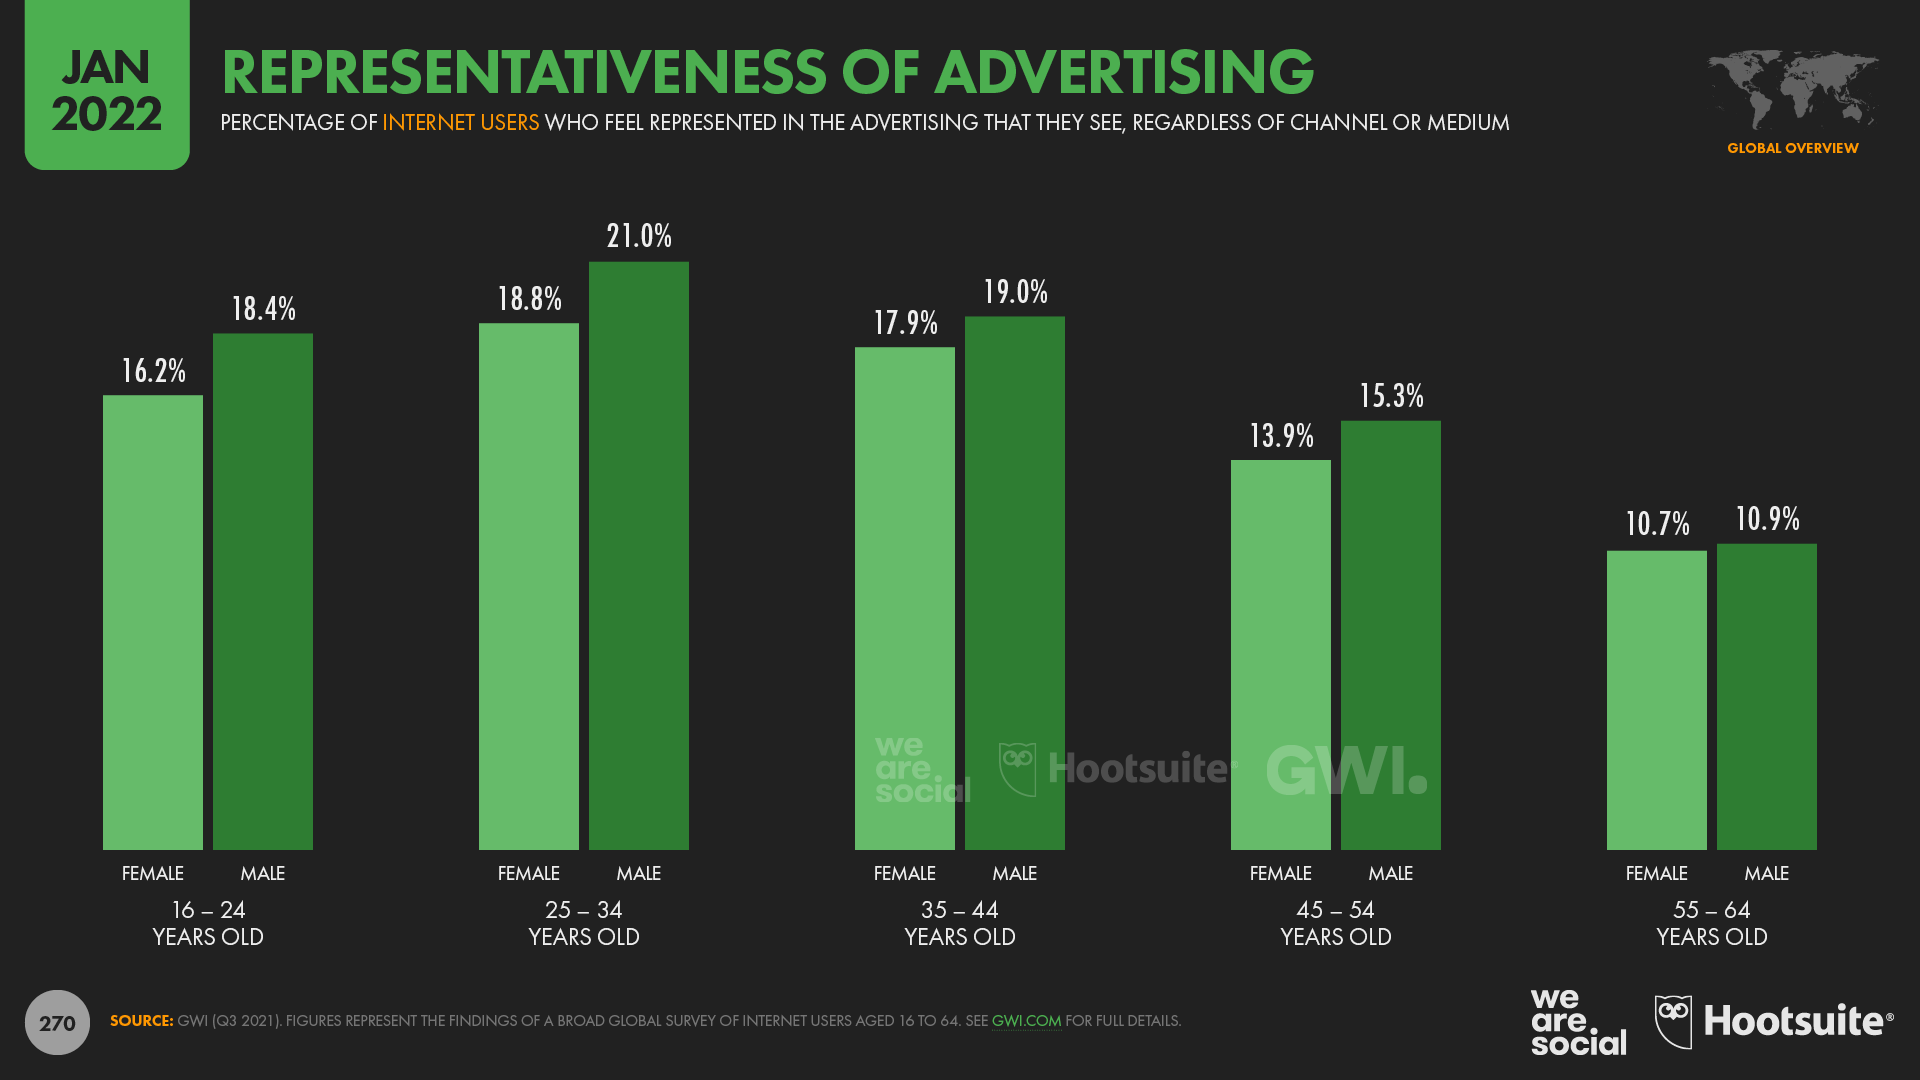
The representativeness of advertising
Another troubling finding in this year’s data is that barely one in six working-age internet users (17.3%) says that they feel represented in the ads that they see, regardless of the advertising medium.

At the better end of the scale, GWI reports that people in China are the most likely to say that they feel represented in ads, with just over one in four (26.8%) answering in the affirmative.
However, just one in nine Americans has a similar perspective, and the figure drops to just one in 11 for people in the UK.
Japan sits at the bottom of the rankings, with just one in 24 respondents in the country saying that they feel represented in the ads that they see—despite Japanese brands spending more than USD $47 billion on advertising in 2021.
However, this poor result may in part be due to Japan’s high median age.
Indeed, GWI’s data highlights the fact that, all over the world, older people feel particularly detached from advertising, with just one in nine global internet users aged 55 to 64 (10.8%) saying that they recognize themselves in the advertising that they see.
But therein lies one of the many challenges in interpreting and acting on this data.
Should advertising actually reflect the audience that it’s aimed at, or should it offer an alternative perspective (e.g. a more “aspirational” lifestyle)?
This is one of the more contentious questions in marketing, and, sadly, there are no simple answers.
The best advice I can offer is to invest both time and resources in understanding not only what your specific audience’s life looks like, but also in understanding people’s hopes, dreams, and fears.
Conventional research will be an invaluable tool here, and many of the data partners featured in this year’s reports will be able to help.
I firmly believe that regular social listening can provide some of the most powerful insights into what people actually care about.
So, as you put the finishing touches to those 2022 plans, be sure to put aside some time and money for active exploration of what matters to your audiences, and what “ad representativeness” might look like on their terms.
Ecommerce continues to boom
As we predicted in our Digital 2021 reports, the increases in ecommerce adoption that we’ve seen since the start of the COVID-19 pandemic show no signs of abating, even as movement restrictions come and go.
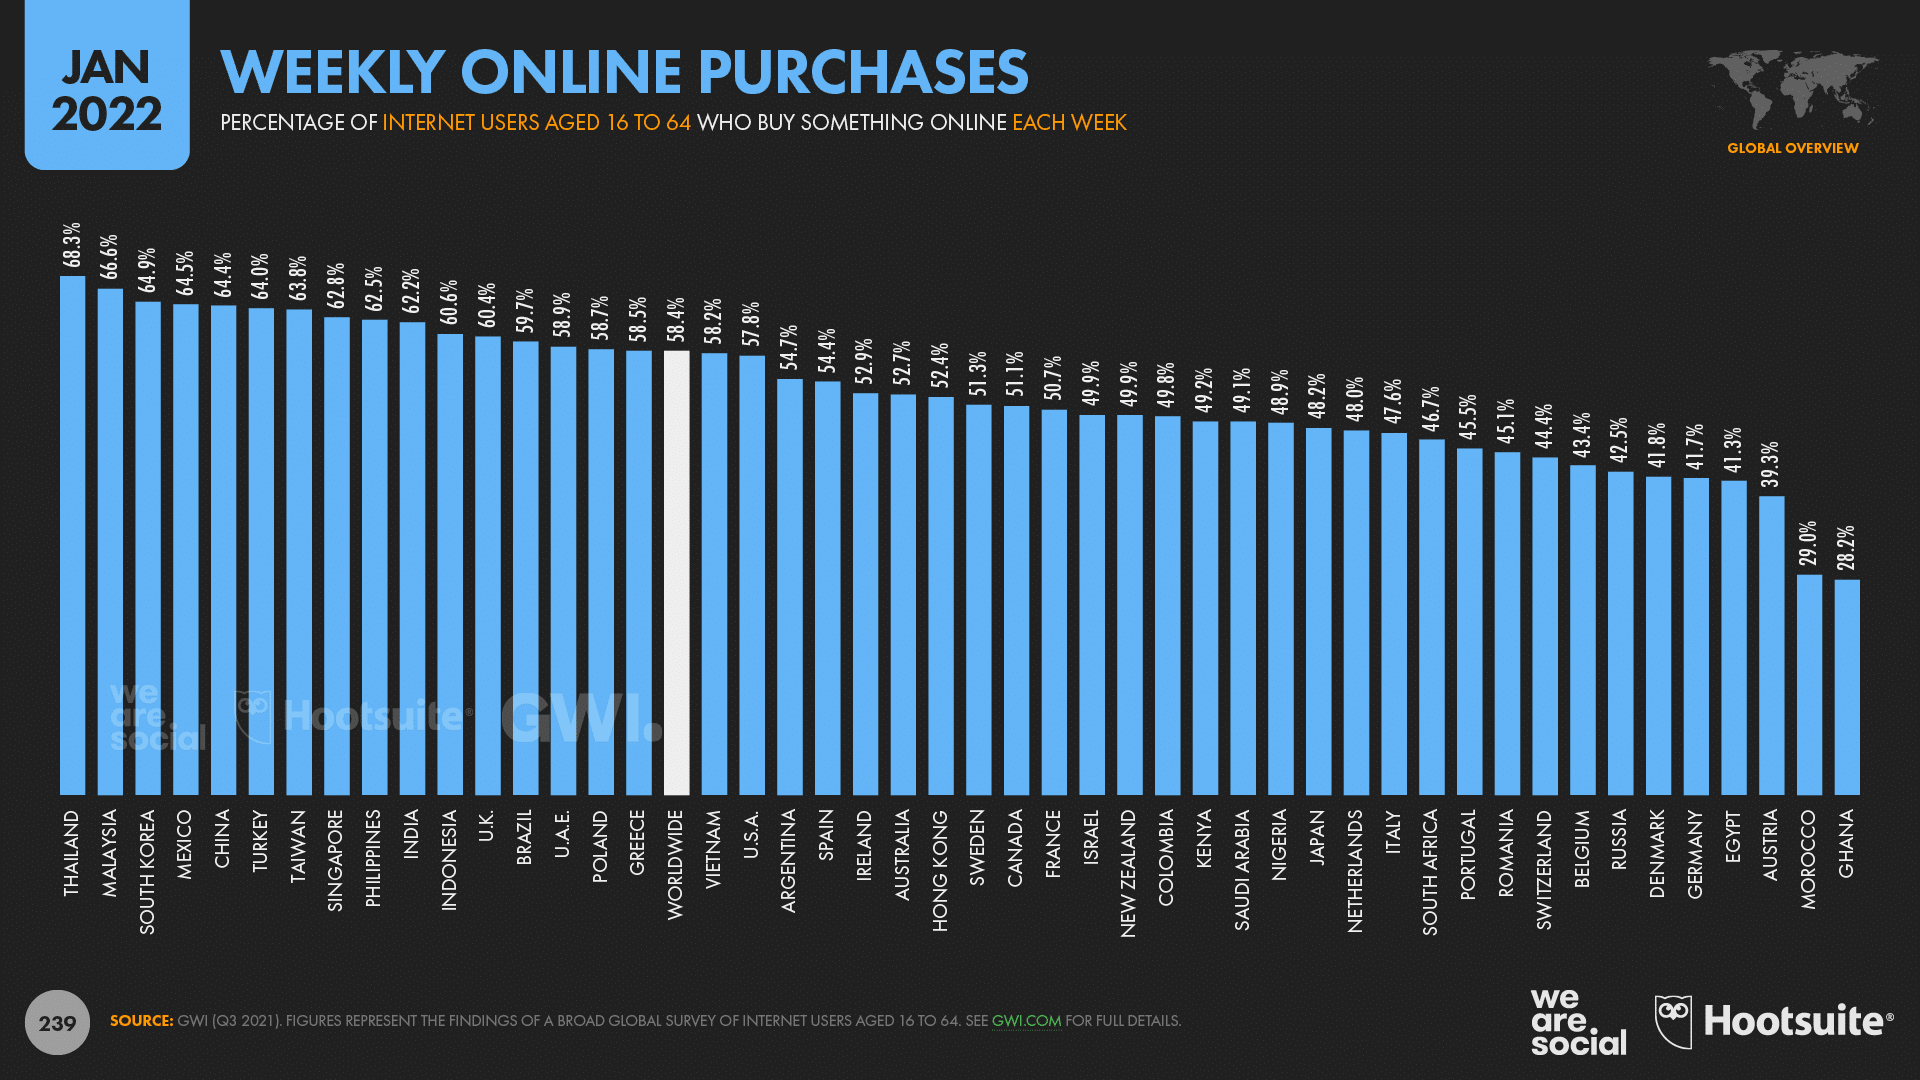
Data from GWI shows that nearly six in 10 working-age internet users (58.4%) now buy something online every week, with that figure continuing to rise throughout 2021.
Many of our lockdown-inspired behaviors have also endured, even as people venture back out into the world.
For example, almost three in 10 of us (28.3%) now buy groceries online every week, with the absolute number of online grocery shoppers increasing by 10% in just the past six months.
Meanwhile, spending in the grocery category has grown even faster than user numbers have.
Figures in Statista’s Digital Market Outlook show that online spend in the the Food and Beverages categories grew by more than 35% during 2021, with total annual revenue across these two categories reaching $588 billion.
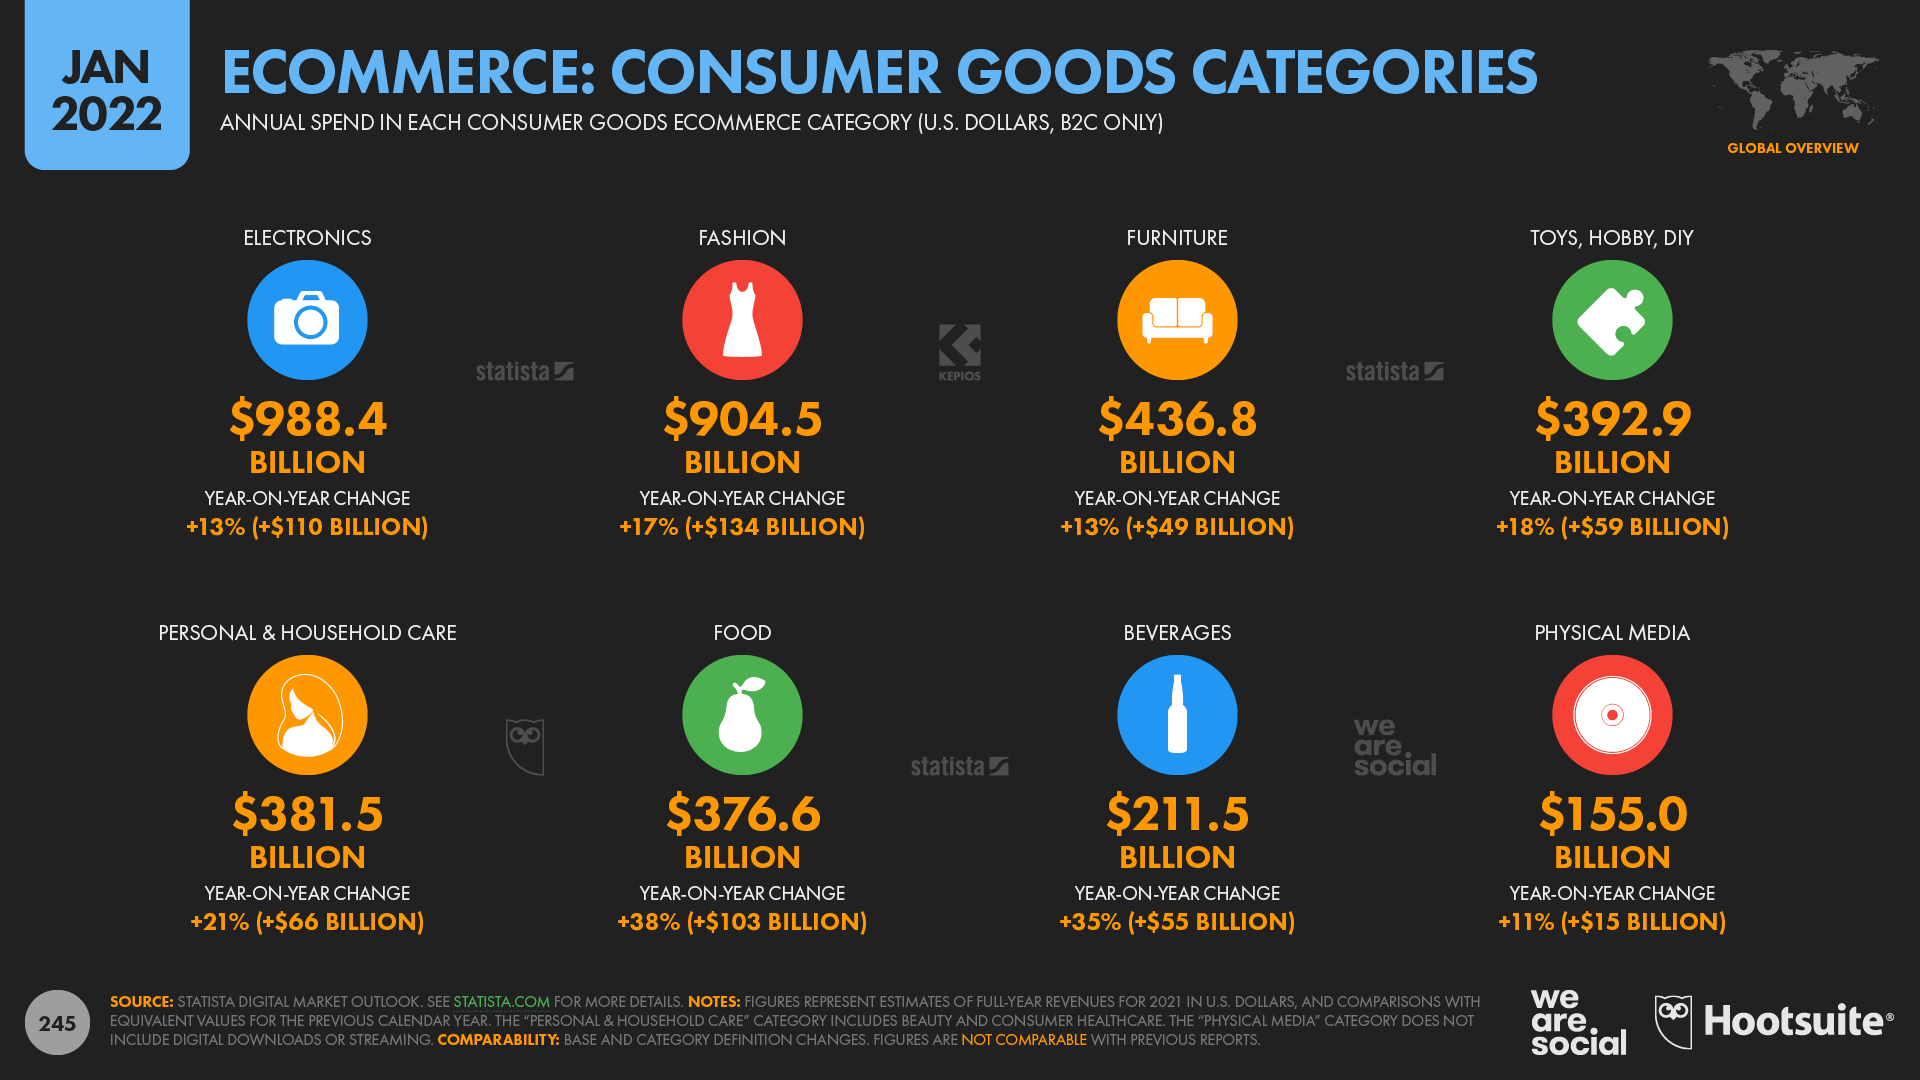
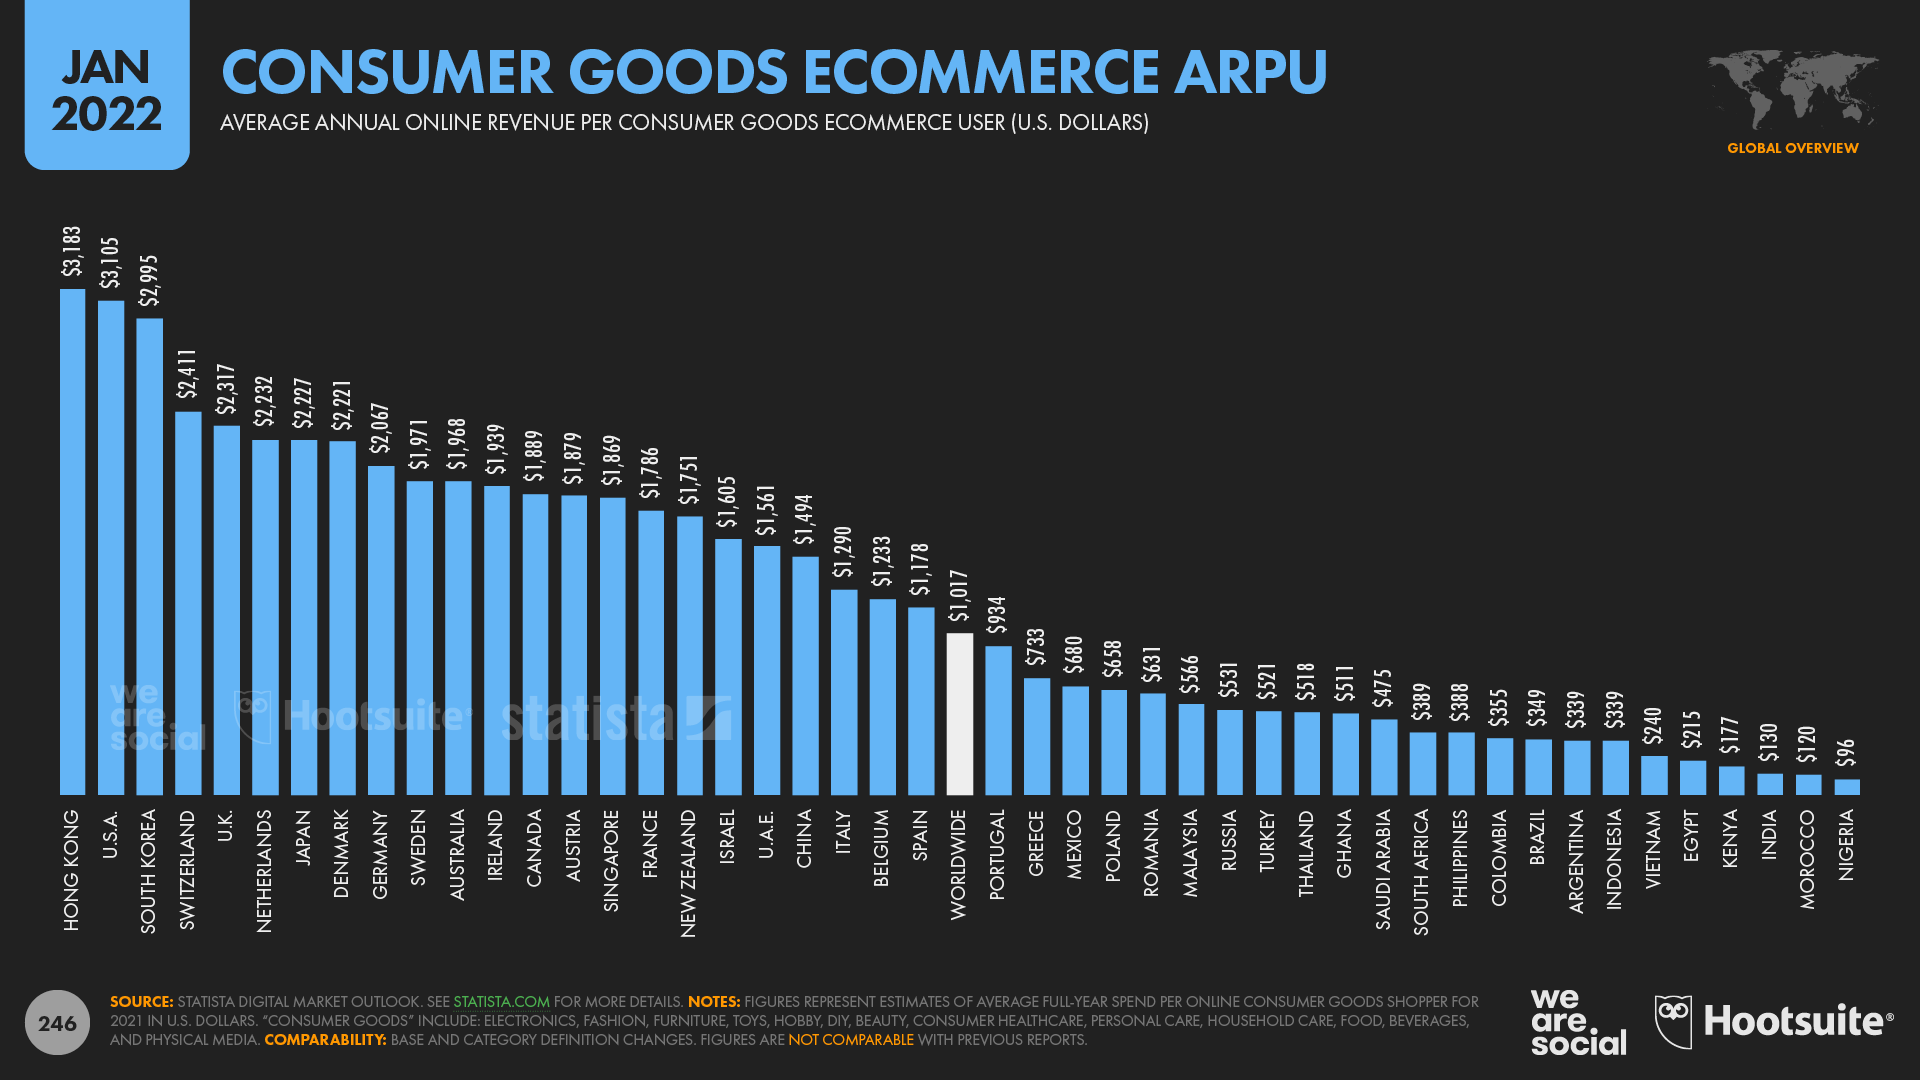
Overall, global revenues associated with online purchases of “consumer goods”—which include groceries, fashion, electronics, and other household items—increased by more than half a trillion US dollars during 2021 (+18%), reaching a total of USD $3.85 trillion for the year as a whole.
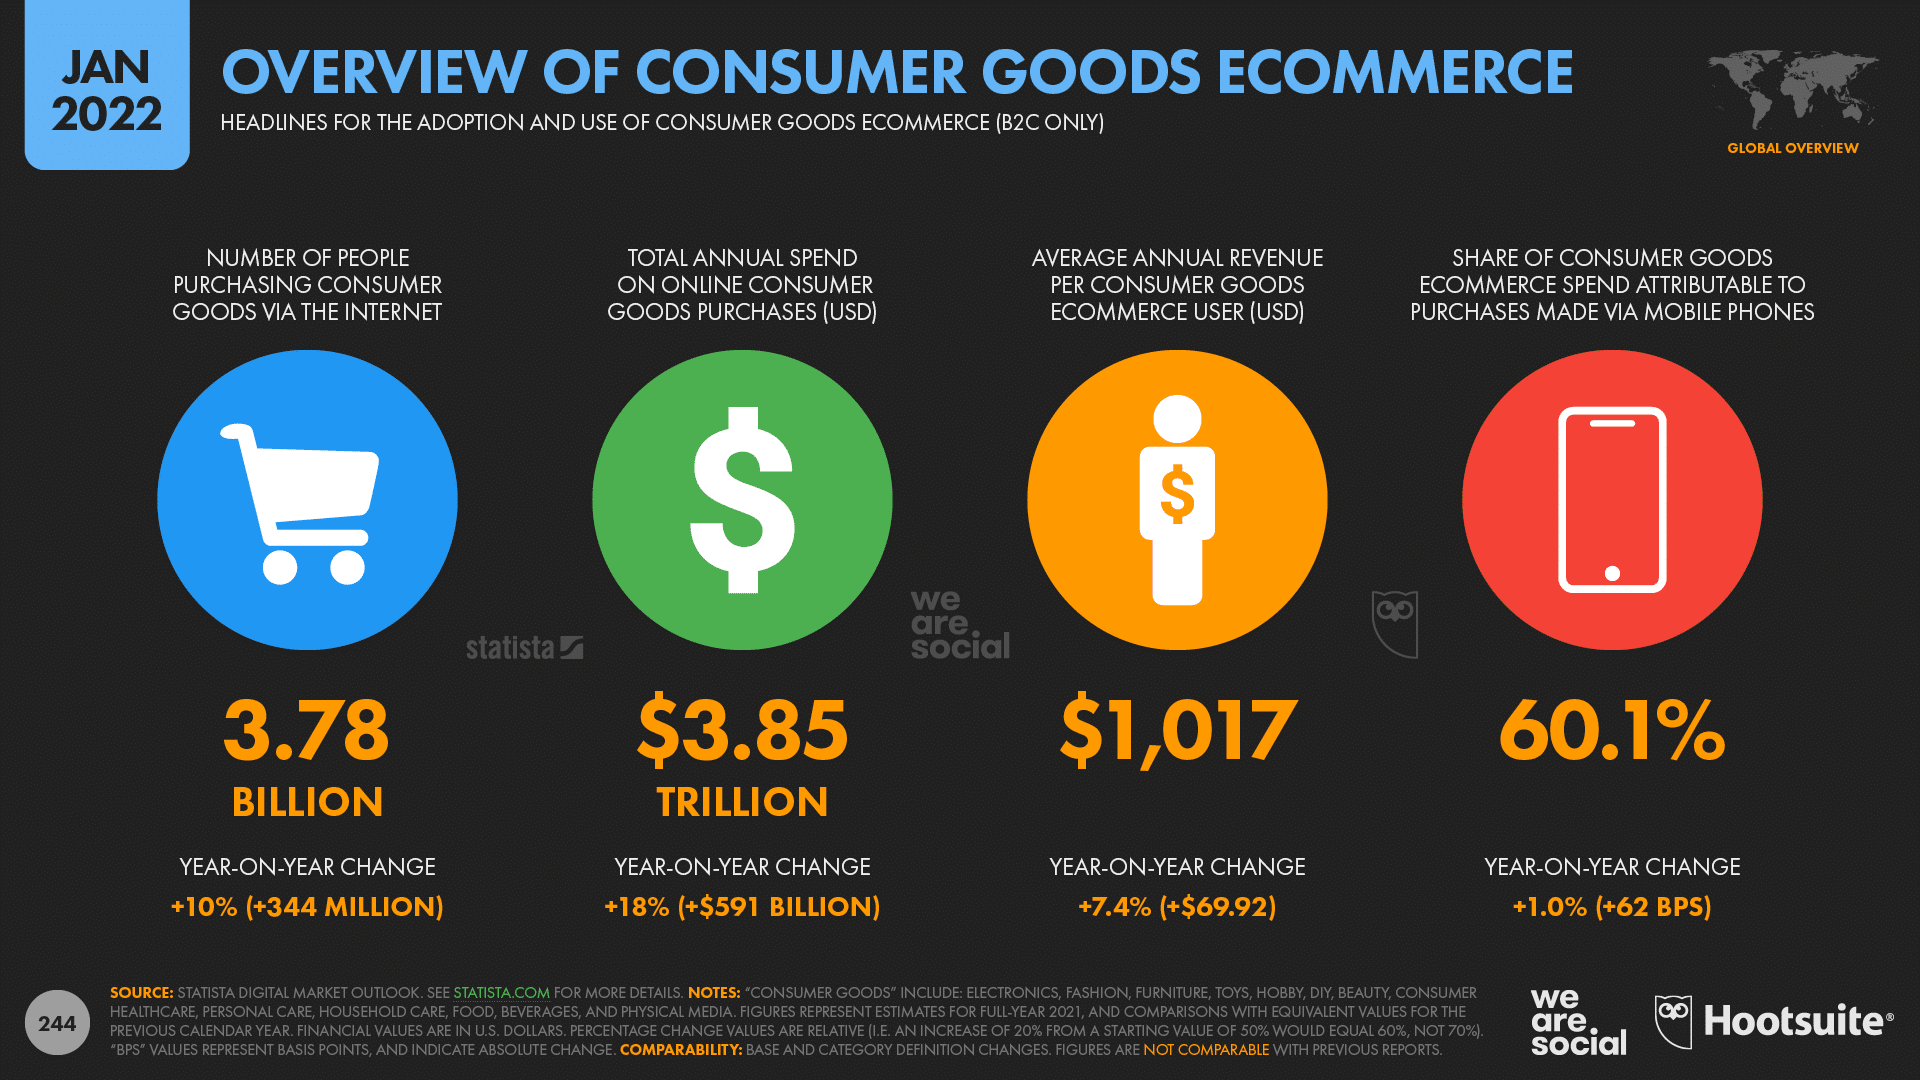
Statista’s data also reveals that the world’s ecommerce shoppers now spend an average of more than USD $1,000 per person, per year on online consumer goods purchases.
However, once again, the story varies considerably by geography.
Average revenue per user (ARPU) for online consumer goods purchases now exceeds USD $3,000 per year in Hong Kong and the United States, but remains below USD $100 in Nigeria.
There’s some more optimistic news for travel brands in this year’s data, too.
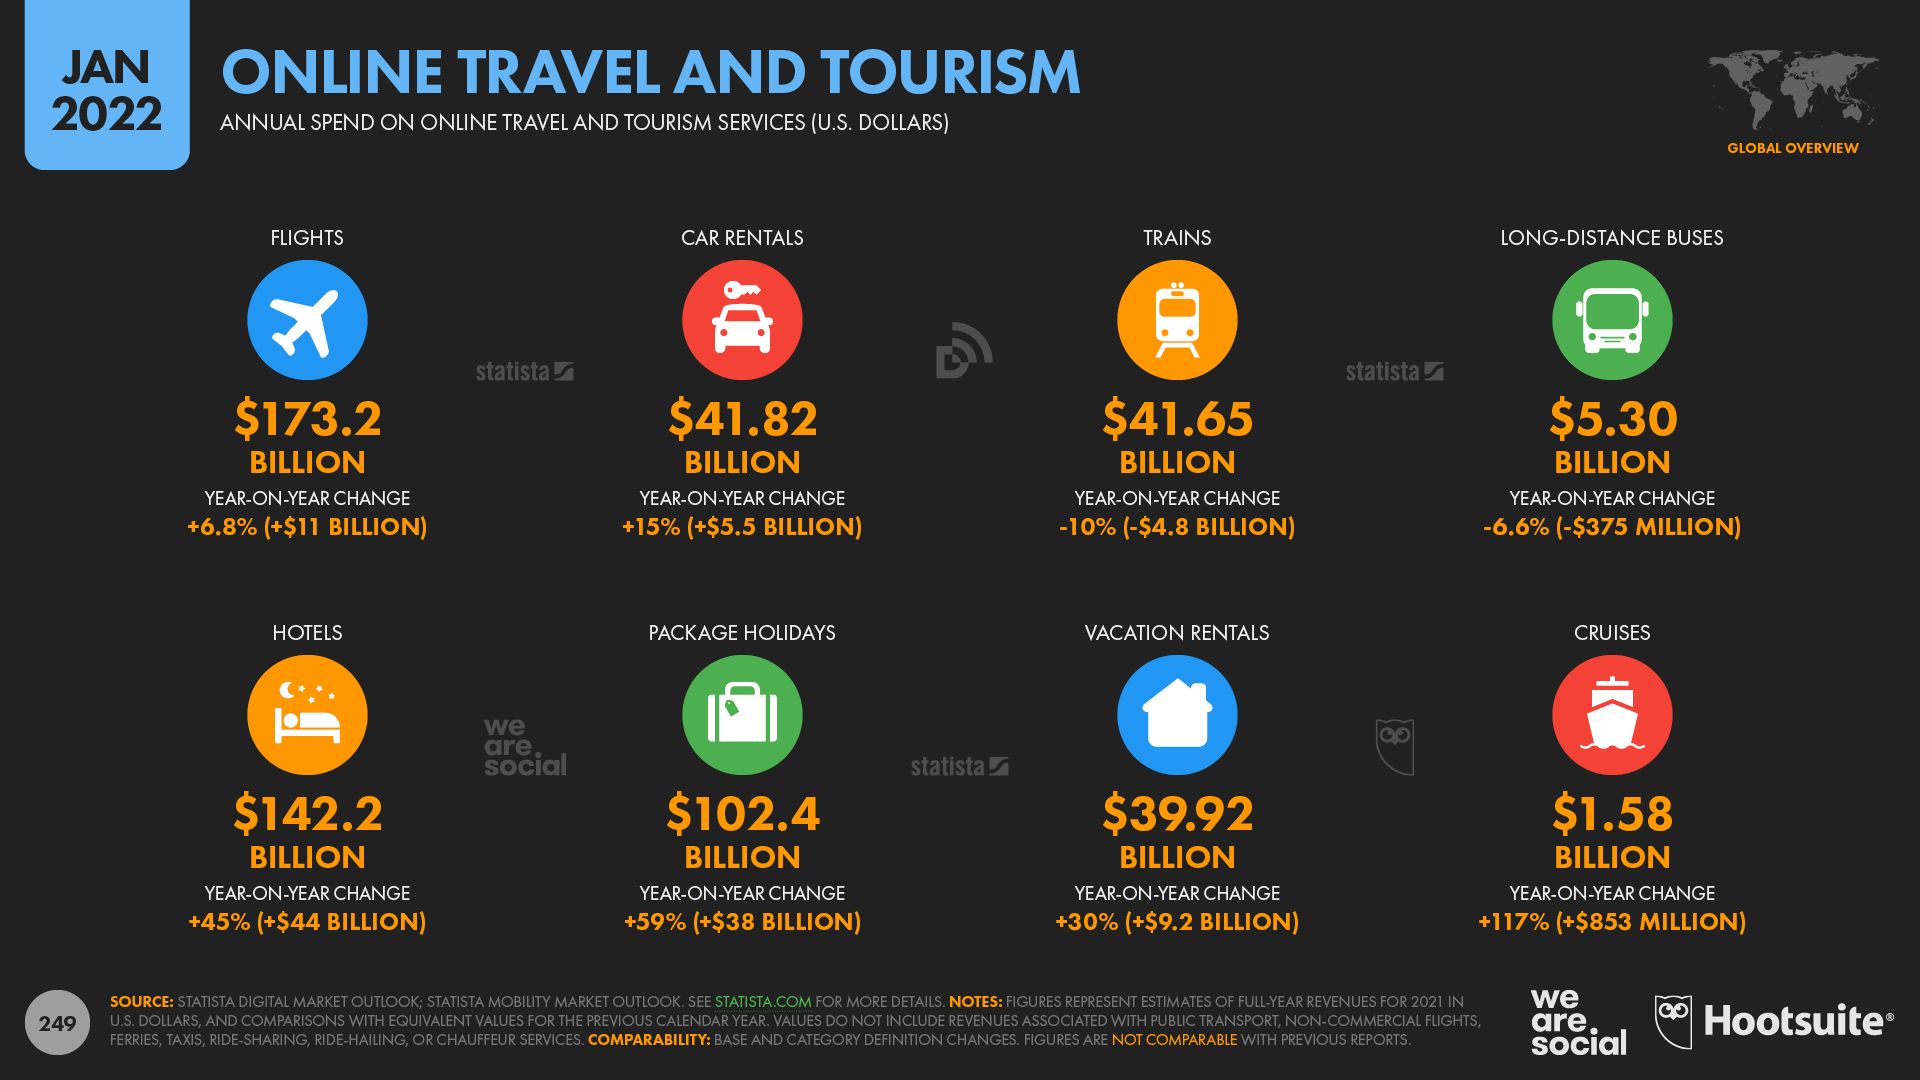
Online travel revenues remain considerably lower than they were in 2019, but consumer spending has increased steadily over the past 12 months.
Statista’s Mobility Market Outlook reports that global online spend on flights grew by USD $11 billion (+6.8%) in 2021, reaching a total of USD $173 billion for the year.
The value of online hotel bookings has increased even faster though, with global revenues up by 45% compared with last year.
The world spent $142 billion on online hotel bookings in 2021, with annual revenues increasing by USD $44 billion compared with the overall total for 2020.
But the latest data also reveal that ecommerce isn’t just about getting “the latest and greatest”.
Research from GWI reveals that ‘recommerce’ is also an increasingly popular choice, with one in seven internet users aged 16 to 64 (14.4%) buying a used or second-hand item online each week.
Social commerce takes off
New additions to this year’s reports include figures for ad reach on Facebook Marketplace and Instagram Shop.
These figures only represent the number of users that marketers can reach with ads in these environments, and they may not represent the full extent of each environment’s total active user base.
Indeed, Meta reports that more than 1 billion Facebook users access Marketplace each month, so there seems to be quite a big gap between total Marketplace users, and the share of those users that sees ads within Facebook’s commerce environment.
However, this gap exists across other Meta products too, and our analysis suggests that Facebook’s overall ad reach only equates to about 72% of the platform’s total monthly active user figure. [Find some potential explanations on Data Reportal.]
What’s more, these Marketplace and Instagram Shop figures still tell a compelling story, and further demonstrate that social commerce has already gained rapid momentum.
For example, ads in Facebook Marketplace now reach more than 560 million users each month, equating to more than a quarter of the platform’s total ad reach.
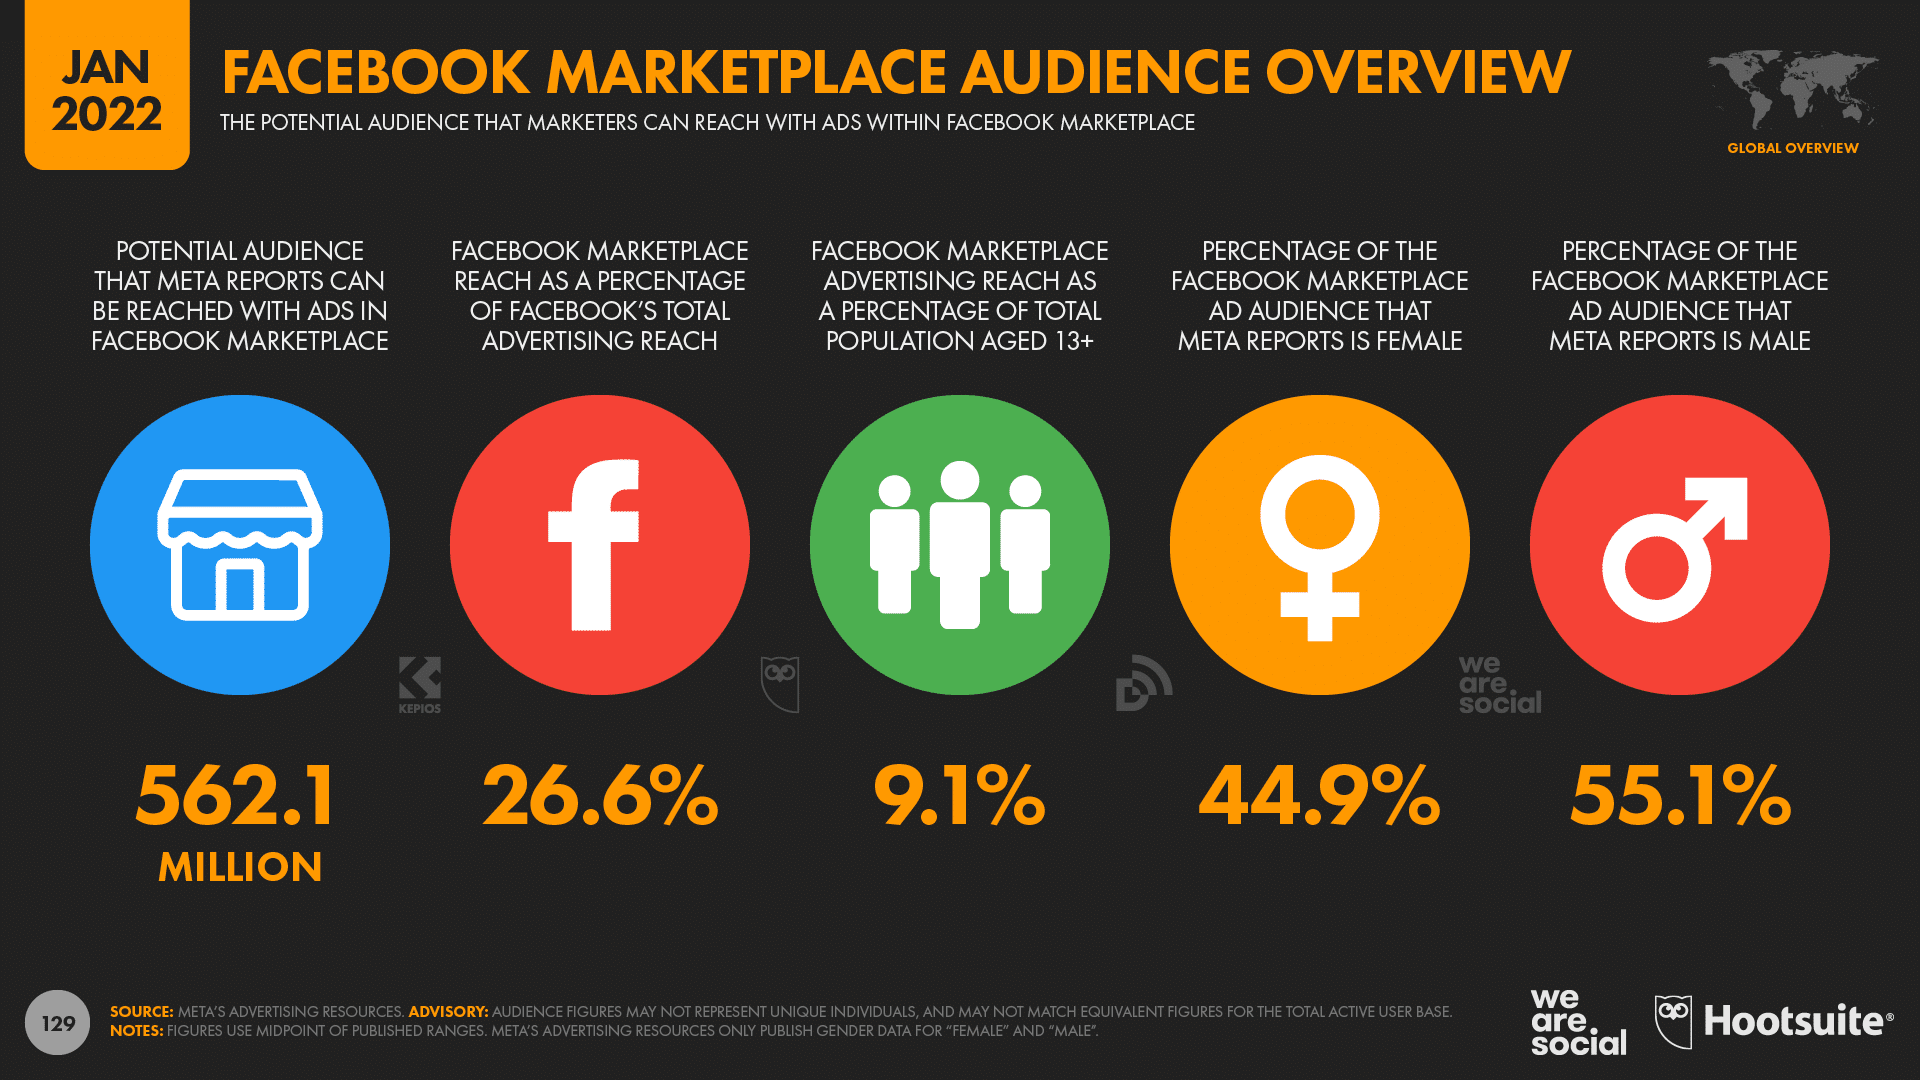
In line with overall platform demographics, Facebook Marketplace attracts a larger male audience, with men accounting for 55% of the Marketplace audience.
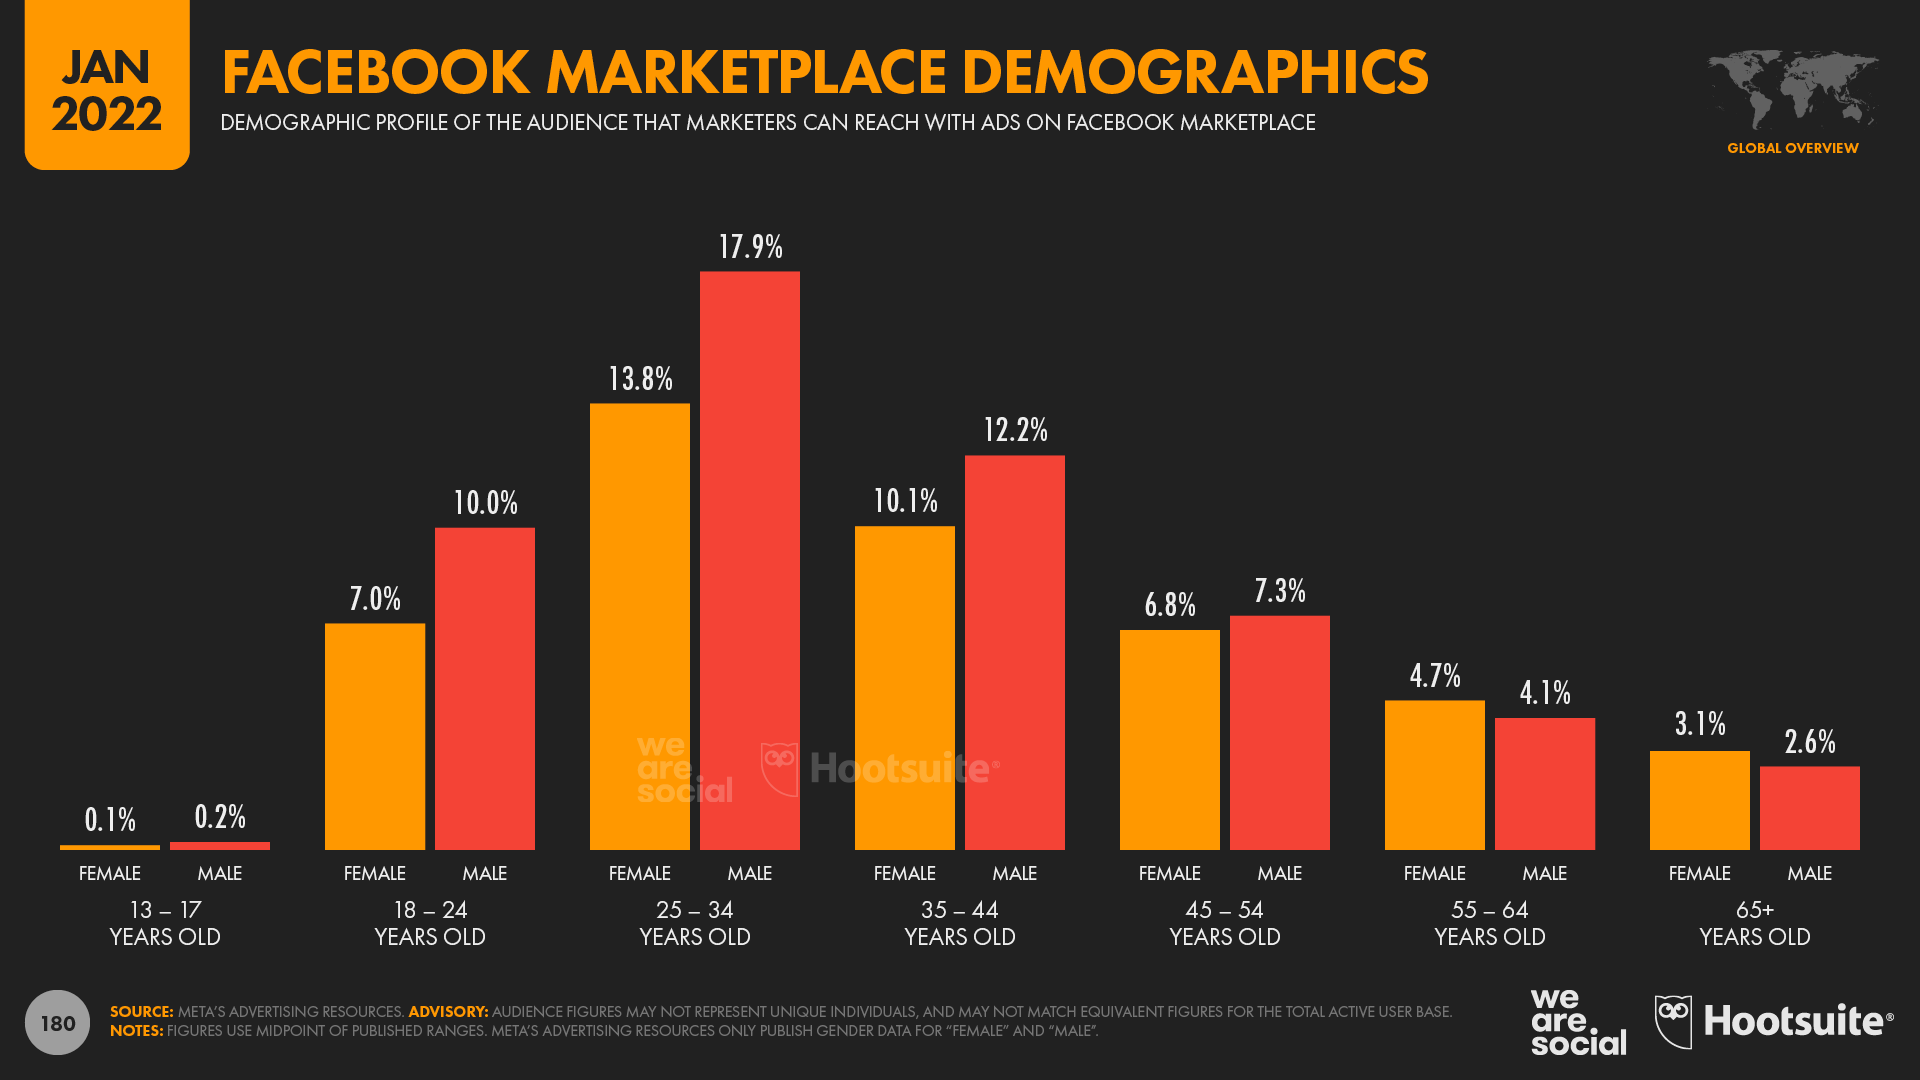
However, the more interesting finding is that the Marketplace audience tends to be considerably older than the Facebook audience as a whole.
Users over the age of 35 account for more than half (50.9%) of Marketplace’s global ad audience, yet they account for just 40.9% of Facebook’s overall ad audience.
Note that Facebook limits use of Marketplace to users aged 18 and above, which explains why figures in the lowest age bracket are so low.
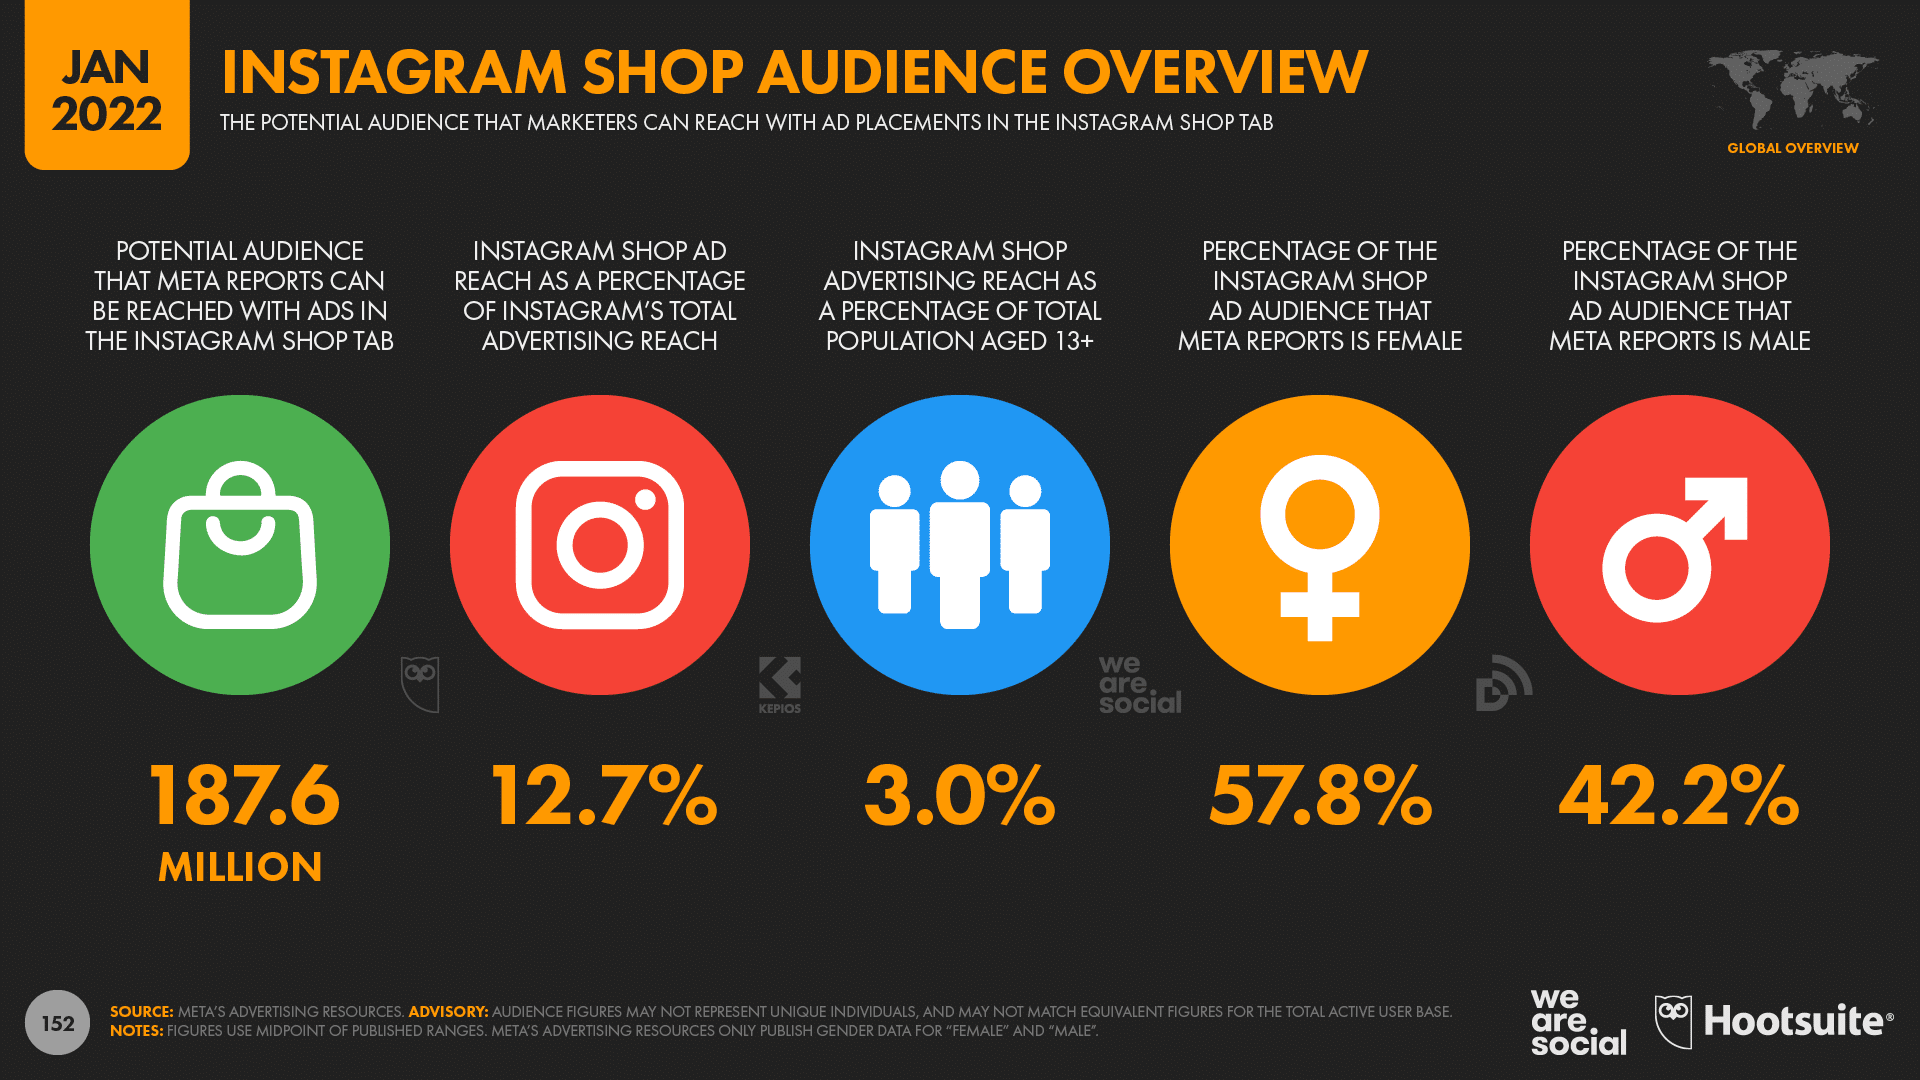
Instagram Shop has also started to gain momentum, with Meta’s tools reporting that advertisers can now reach more than 187 million users with ads in the Shop tab each month.
However, in contrast to the findings for Marketplace above, the data indicate that women account for a much greater share of Instagram Shop’s global ad audience.
Discover the latest data and insights on social media, the internet, mobile, and other digital behaviors in the Digital 2021 Report.
Best-in-class data
As always, I’d like to say a very big thank you to the world-class data partners who’ve made this year’s reports possible, especially:
Important notes about the data
I’d like to encourage all readers to review our detailed notes on data, to understand how changes in data sources and methodologies may impact this year’s numbers.
Alerts to highlight include:
- Internet users: delays in reporting due to COVID-19 may mean that figures for “year-on-year change” represent change over periods of more than one year.
- Social media users: big changes in platform reporting mean that various numbers included in this year’s reports are not directly comparable with figures for the same data points featured in our previous reports. Where we’ve been able to calculate representative growth figures, we’ve included those growth figures within this year’s reports, but where we haven’t included growth figures, it’s likely that any comparisons with historical data will deliver incorrect values. As a result, please avoid comparing social media users and advertising audience figures in this year’s reports with figures published in our previous reports.
Easily manage all your social media in one place and save time with Hootsuite.
The post TikTok Gains 8 New Users Every Second (And Other Mind-Blowing Stats) appeared first on Social Media Marketing & Management Dashboard.


Recent Comments