Streamline Your Reporting Process with Data Studio
When it comes to reporting on marketing activities, it’s not always fun or easy to understand from an outside perspective. If you’re not as involved on a day-to-day basis, or if you’re manually having to pull reports throughout the week these tasks can become quite cumbersome.
In this article, you will learn about 10 key benefits of Google Data Studio, a free tool that allows you to transform your data into eye-catching visualizations and engaging reports that are easy to understand.
What’s Included
Table of Contents
- FREE Tool
- Customizable Report Dashboards
- Modern & Interactive Data Visualizations
- Automated Reports with Real-Time Data
- Shareable Dashboards
- Data Studio Exports
- Drill Down Capabilities
- Connects to Multiple Data Sources
- Filter Tools
- Calculated Fields
- Additional Resources
Benefit #1: It’s FREE!
A frequently asked question to those who are unfamiliar with this tool is “Does Google Data Studio cost money”? The answer to that is no! Google Data Studio is a FREE tool that is available for anyone to use.
Benefit #2: Customizable Report Dashboards
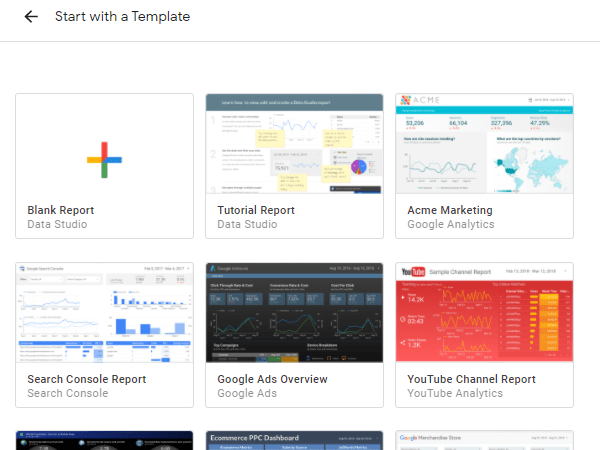
Google Data Studio allows users to create custom reports with a wide range of designs, styles, graphs, and formatting. If you’re new to Data Studio, then there are plenty of pre-templated reports to choose from. Otherwise, you can start from scratch and create one entirely unique to your reporting style.
Here are some of the things you can customize:
- Page layout
- Text
- Graphs
- Metrics
- Style Elements
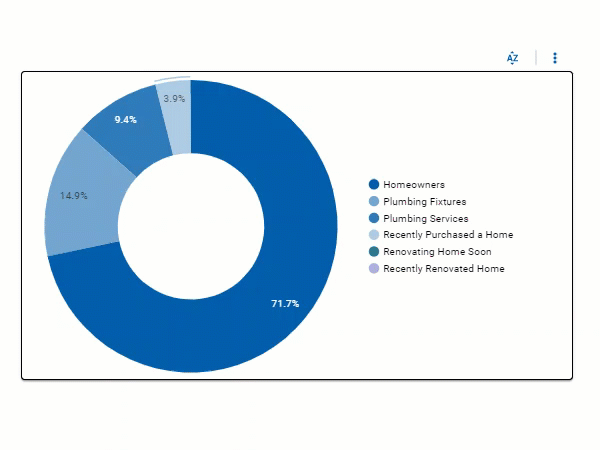
Benefit #3: Modern & Interactive Data Visualizations
With Google Data Studio you don’t need the skills of a graphic designer to create modern-looking reports! With a few clicks, you can easily create an engaging and visually appealing dashboard that is sure to “wow” your audience.
Not only do they look great, but you also have the ability to include interactive features that will allow the report viewer to:
- Control the date range
- Set different filters
- Sort by different metrics
- Select optional metrics
- Drill down into data
Benefit #4: Automated Reports with Real-Time Data
Manually exporting data and formatting reports can become very time-consuming. What if you could automate all those routine reports to spend less time building them, and more time on actionable insights?
Google Data Studio allows you to build fully automated reporting dashboards with real-time data, which saves you countless hours on reporting.
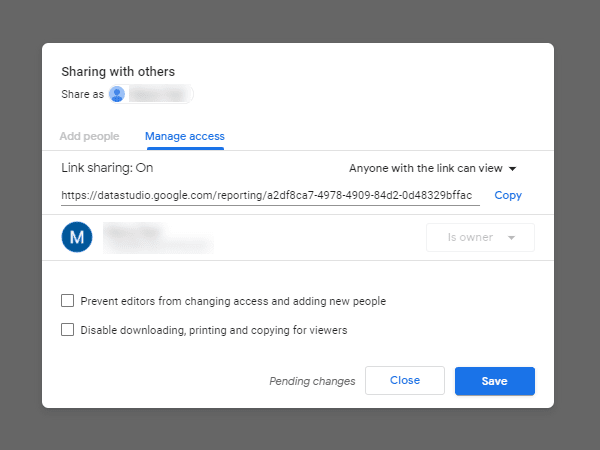
Benefit #5: Shareable Dashboards
Google Data Studio has report sharing and collaboration features that can help streamline communication among your peers and business partners. You can choose between viewer or editor access and share your reports via the following:
- Link sharing
- Email permissions
- Scheduled email deliveries
Shared users can view the report at any time making it easy and convenient for the individual to stay updated with real-time data.
Benefit #6: Google Data Studio Exports
After you finish creating your report dashboard, you then have the ability to export it to the following documents:
- Excel
- Google Sheets
Most individuals have their own preference when it comes to reporting, so this can be especially helpful for those who prefer Excel documents to dashboards. Additionally, you can schedule automated email exports that will send a PDF version of the report to a number of individuals, like managers, direct reports, and even clients!
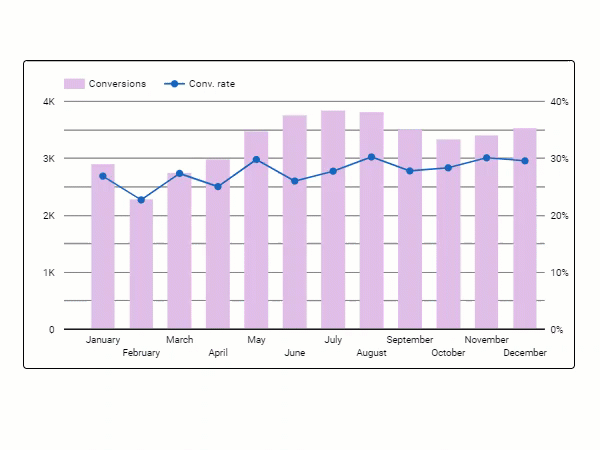
Benefit #7: Drill Down Capabilities
As all digital marketers know, when it comes to reporting there are many different levels at which we can measure and view performance. Google Data Studio enables you to drill down into your data all within a single chart or element.
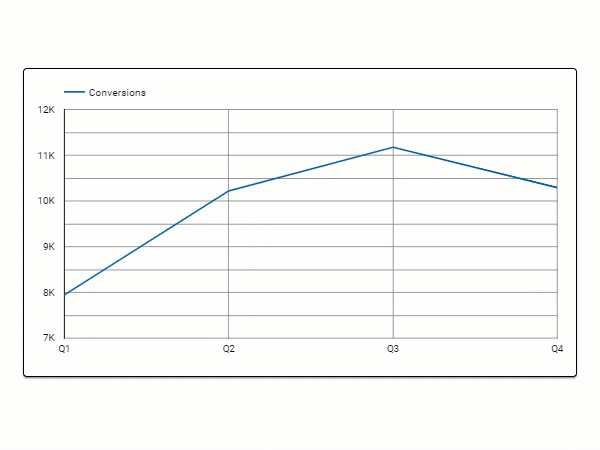
In the example above, with a few clicks, you’re able to visualize trendlines over different time periods (month, week) without having to reconfigure the entire dataset.
Benefit #8: Connects to Multiple Data Sources
A healthy marketing mix contains various strategies and tools leveraged to reach your audiences. Google Data Studio allows you to connect to multiple data sources (Google Ads, Google Analytics, Google Search Console, Sheets, etc.) all within a single dashboard.
Whether you’re reporting on social media, search engine optimization, or Google Ads, you can easily do so by connecting multiple data sources to your Google Data Studio dashboard.
Not only that, but you also have the ability to blend data from different data sources to create a “full picture” by using a join key.
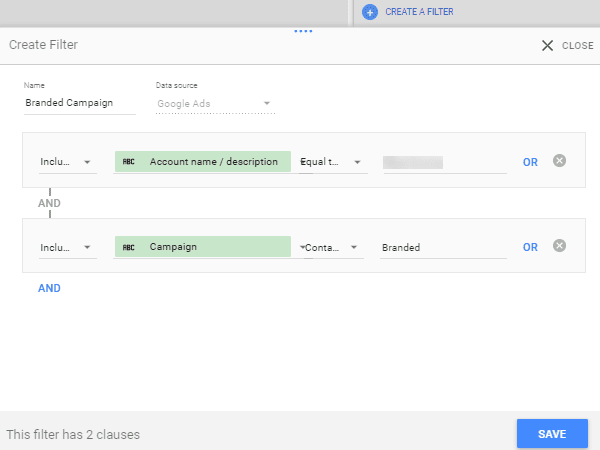
Benefit #9: Filter Tools
Filters in Google Data Studio will allow you to refine your data based on any dimension or metric. Some of the most common filters include:
- Date range
- Account
- Campaign
- Location
There are multiple ways to apply report filters. They can be done at the report level, page level, or chart level. Filters can also include conditions such as and/or to further refine your data.
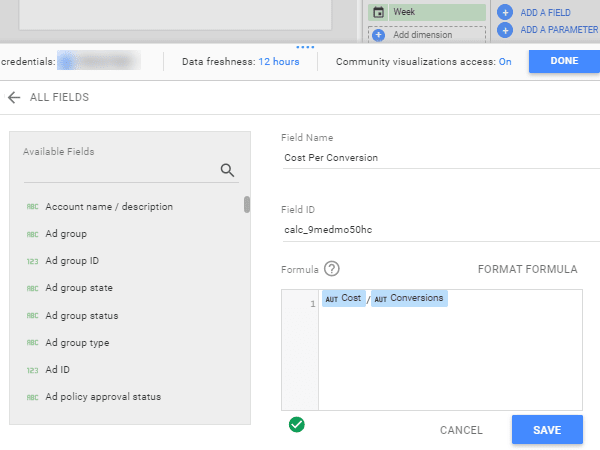
Benefit #10: Calculated Fields
To put it simply, calculated fields in Google Data Studio are very similar to the formulas that would be used in an Excel spreadsheet such as:
- Basic math (add, subtract, multiply, divide)
- Functions (more complex equations and statistical operations)
- CASE statements (if/then/else logic)
For example, if you are trying to calculate your cost-per-conversion, but you don’t already have that metric imported you can create your own calculated field within Data Studio.
Additional Google Data Studio Resources
Now that you’ve learned about the advantages of Google Data Studio, how do you think it will help enhance your reporting? The best way to find out is to get started by creating your own dashboard or try using one of the many pre-made templates provided by Google.
If you’re interested in learning more about Google Data Studio, check out the following resources for more information:
- Introduction to Data Studio video by Google Analytics Academy
- Welcome to Data Studio by Google
- Data Studio overview by Google Marketing Platform
Next time you go to export an Excel spreadsheet, give Google Data Studio a try instead!
How Does Blue Corona Use Google Data Studio?
Our team of digital marketing experts leverages Google Data Studio to create customized and automated report dashboards for our clients.
Less time is spent on building reports, and more time is invested towards developing and implementing data-driven insights. Clients can visually interpret performance results with full transparency, which in turn helps them make educated business decisions driven by thoughtful insights.
Want to learn more about our award-winning digital marketing services? Contact us to request a free marketing consultation!


Recent Comments